Trading US Corporate Bonds: It Pays to Be Flexible
Flexible bond trading can add value. Choosing similar lower-cost corporate bonds can reduce trading expenses and improve investors’ net returns over time.


KEY TAKEAWAYS
- Corporate bonds exhibit sizable dispersion in trading costs due to less frequent trading.
- From 2013 to 2024, high-cost US corporate bonds underperformed low-cost substitutes over a three-month holding period by 20 bps on average, net of transaction costs.
- An investment approach that allows for flexible bond selection and cost-efficient trading can benefit investors in the long run.
Corporate bonds are a significant part of the fixed income opportunity set for investors. For example, over 8,000 corporate issues with a market value of nearly $7 trillion were included in the Bloomberg US Aggregate Bond Index as of December 2024. While corporate bonds can offer portfolio diversification and higher yields compared to government bonds, they tend to trade less frequently and at larger spreads.
In our recent paper,1 using 159 million trades across 29,032 US corporate bonds in the Bloomberg index universe, we find that while trading costs have fallen over time, sizable cost dispersion remains between similar bonds. This is good news for investors with flexibility: by substituting higher-cost bonds with lower-cost bonds of similar characteristics, they can improve net returns while achieving the desired exposures.
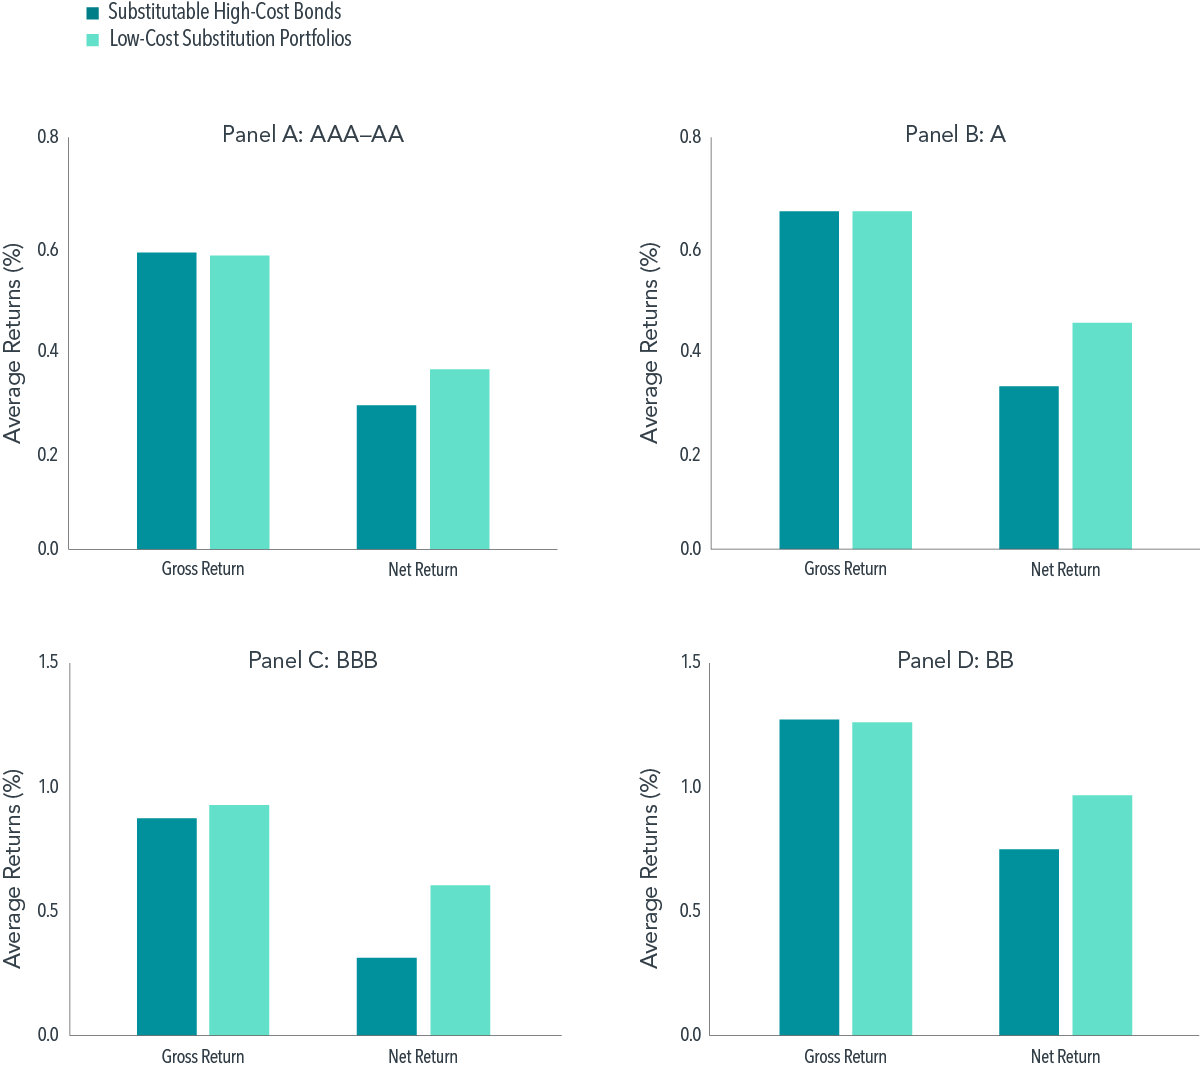
To quantify the benefit of flexible trading, we compared the returns of high-cost bonds to low-cost substitution portfolios, controlling for credit quality, duration, and gross expected return (mid-yield).2 From 2013 to 2024, low-cost substitutes outperformed high-cost bonds by an average of 20 bps net of transaction costs, over a three-month holding period, while their gross returns are similar. This pattern is consistent across different credit quality groups (AAA–AA, A, BBB, and BB), as shown in Exhibit 1.
These results suggest that the ability to substitute high-cost bonds with low-cost alternatives can help reduce transaction costs without impacting portfolio exposures. In contrast, a lack of flexibility in portfolio design and trading can increase costs.3 More broadly, an investment approach that allows for flexible bond selection and cost-efficient trading can benefit investors in the long run.
EXHIBIT 1
Three-Month Realized Gross (Mid-Price) Returns and Net Returns (%) of Substitutable High-Cost Bonds and Low-Cost Substitution Portfolios
June 2013–Dec 2024
Footnotes
1. Aabbhas Garg and Samuel Wang, “Transaction Costs of US Corporate Bonds and Benefits of Flexible Trading” (research paper, Dimensional Fund Advisors, July 2026).
2. Transaction costs are estimated using the average effective spread over the past 10 days. For a bond on a given trading day, the effective spread is the difference between the trade quantity-weighted customer-buy price and the trade quantity-weighted customer-sell price, scaled by the midpoint of those two prices. For further details, refer to Figure 1.
3. Aabbhas Garg and Samuel Wang, “The Reconstitution Cost of US Corporate Bond Indexing” (research paper, Dimensional Fund Advisors, August 2026).
Glossary
Duration: Bond duration measures a bond’s price sensitivity to interest rates.
Gross expected return: Same as mid-yield.
Mid-yield: The midpoint yield between trade quantity-weighted customer-buy and customer-sell yields
Mid-price: The midpoint price between trade quantity-weighted customer-buy and customer-sell prices.
Gross return: The gross return is the total return before accounting for transaction costs. This is computed using the mid-price of the bond between the buy and sell date.
Net return: The total return after accounting for transaction costs. This is calculated using the trade quantity-weighted buy price at buy date and the trade quantity-weighted sell price at sell date.
Market-value-weighted portfolio: A portfolio in which each bond’s share is determined by its total market value in comparison to the market value of all bonds in the portfolio.
TRACE: The Trade Reporting and Compliance Engine (TRACE) is the Financial Industry Regulatory Authority Inc. (FINRA) developed vehicle that facilitates the mandatory reporting of over-the-counter secondary market transactions in eligible fixed income securities. All broker-dealers who are FINRA member firms have an obligation to report transactions in corporate bonds to TRACE under a Securities and Exchange Commission (SEC) approved set of rules.
Disclosures
Bloomberg data provided by Bloomberg. Credit ratings are based on index ratings from Bloomberg.
The information in this material is intended for the recipient’s background information and use only. It is provided in good faith and without any warranty or representation as to accuracy or completeness. Information and opinions presented in this material have been obtained or derived from sources believed by Dimensional to be reliable, and Dimensional has reasonable grounds to believe that all factual information herein is true as at the date of this material. It does not constitute investment advice, a recommendation, or an offer of any services or products for sale and is not intended to provide a sufficient basis on which to make an investment decision. Before acting on any information in this document, you should consider whether it is appropriate for your particular circumstances and, if appropriate, seek professional advice. It is the responsibility of any persons wishing to make a purchase to inform themselves of and observe all applicable laws and regulations. Unauthorized reproduction or transmission of this material is strictly prohibited. Dimensional accepts no responsibility for loss arising from the use of the information contained herein.
This material is not directed at any person in any jurisdiction where the availability of this material is prohibited or would subject Dimensional or its products or services to any registration, licensing, or other such legal requirements within the jurisdiction.
“Dimensional” refers to the Dimensional separate but affiliated entities generally, rather than to one particular entity. These entities are Dimensional Fund Advisors LP, Dimensional Fund Advisors Ltd., Dimensional Ireland Limited, DFA Australia Limited, Dimensional Fund Advisors Canada ULC, Dimensional Fund Advisors Pte. Ltd., Dimensional Japan Ltd., and Dimensional Hong Kong Limited.
RISKS
Investments involve risks. The investment return and principal value of an investment may fluctuate so that an investor’s shares, when redeemed, may be worth more or less than their original value. Past performance is not a guarantee of future results. There is no guarantee strategies will be successful.
Fixed income securities are subject to increased loss of principal during periods of rising interest rates. Fixed income investments are subject to various other risks, including changes in credit quality, liquidity, prepayments, call risk, and other factors.
CANADA
These materials have been prepared by Dimensional Fund Advisors Canada ULC. The other Dimensional entities referenced herein are not registered resident investment fund managers or portfolio managers in Canada.
This material is not intended for Quebec residents.
Commissions, trailing commissions, management fees, and expenses all may be associated with mutual fund investments. Please read the prospectus before investing. Unless otherwise noted, any indicated total rates of return reflect the historical annual compounded total returns, including changes in share or unit value and reinvestment of all dividends or other distributions, and do not take into account sales, redemption, distribution, or optional charges or income taxes payable by any security holder that would have reduced returns. Mutual funds are not guaranteed, their values change frequently, and past performance may not be repeated.
Resources