Winning for the Wrong Reason in Small Caps
Short-term performance can mislead. Small cap funds recently benefited from stocks with lower expected returns, showing managers can sometimes win for the wrong


The small cap market has subsets of stocks with lower expected returns. In the US, small cap growth low profitability stocks have lagged the rest of the small cap space by more than eight percentage points, while high asset growth stocks have trailed by more than 12 percentage points.1 However, sometimes the script gets flipped and these stocks unexpectedly outperform. While these periods of outperformance tend not to last, they can make it difficult to evaluate small cap manager relative performance.
Over the past year, the big winners in US small caps happened to have been low profitability and high asset growth stocks. As such, returns for US small cap funds were generally increasing with the amount allocated to these stocks.
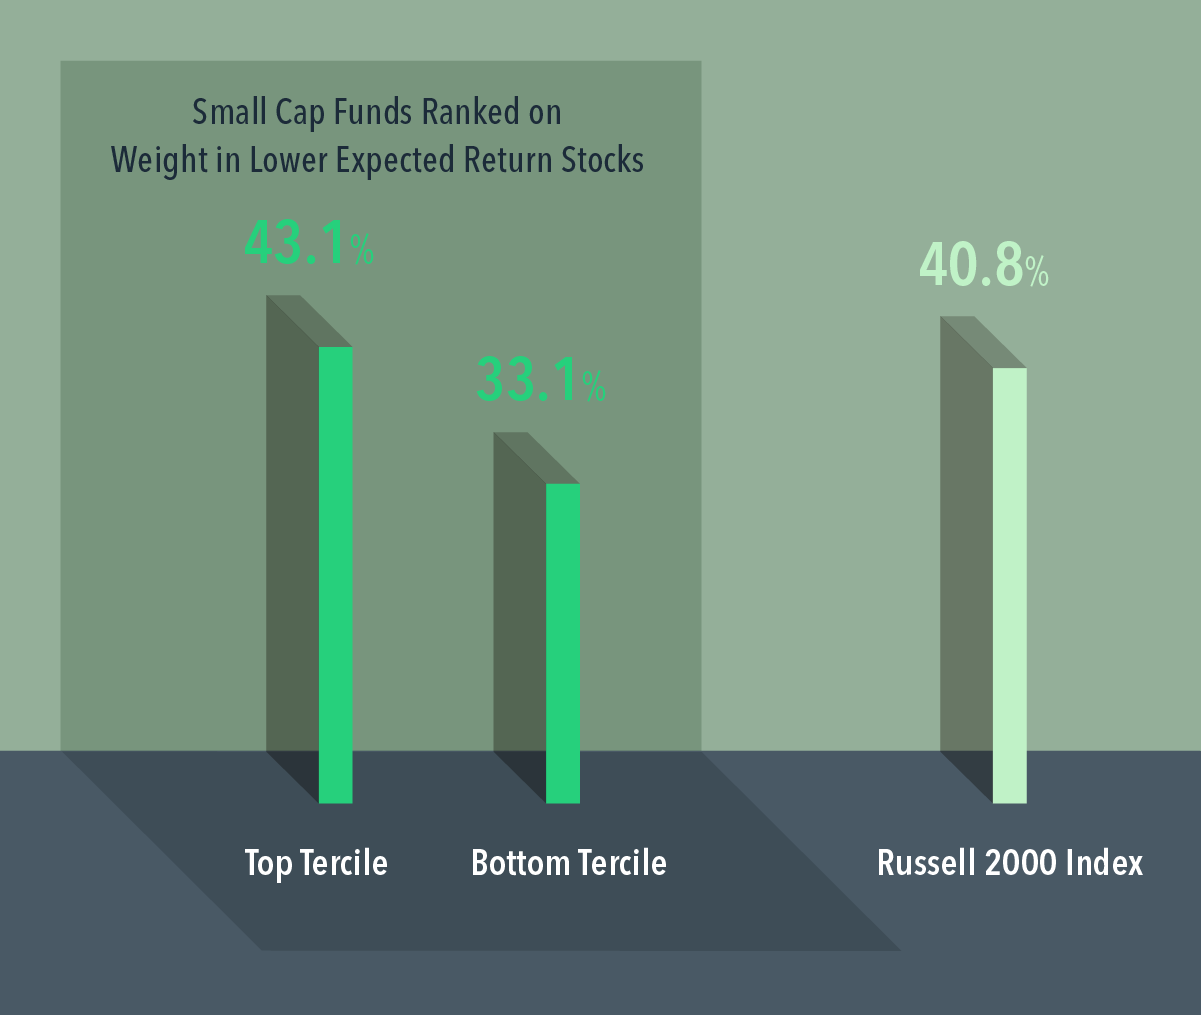
When sorting the 10 largest funds in the category on weight in lower expected return stocks, we see a sizable difference in holdings there: 14.8% for the top tercile versus 4.4% for the bottom tercile. The average return for the top tercile was 43.1%, compared to just 33.1% for the bottom tercile. In other words, a larger allocation to the worst-performing small cap stocks was a tailwind over this period.
This illustrates one of the challenges with short-term performance: Sometimes managers win for the wrong reasons.
EXHIBIT 1
One-Year Return vs. Weight in Lower Expected Return Stocks
Active US small cap equity funds as of June 30, 2026
Footnotes
1. In USD. Relative returns are based on a comparison of the Dimensional US Small Cap Index to the Dimensional US Small Growth Low Profitability Index and the Dimensional US Small High Asset Growth Index, respectively, over the period January 1975–June 2026.
Glossary
Active fund: A fund that aims to outperform a market rate or return, or a specific benchmark, by choosing investments that deviate from the market portfolio or benchmark.
Asset growth: The change in total assets from the prior fiscal year to current fiscal year. Small high asset growth stocks are those securities within the small cap universe that are considered to have high changes in total assets over a fiscal year.
Expected return: An estimate of average anticipated returns informed by historical data.
Growth stocks: Stocks with a high market price relative to their book price.
Indexed fund: A fund that uses a set of rules to determine what assets to hold and at what weights, seeking to mimic the stated index. These funds aim to track the index’s performance.
Profitability: A company’s operating income before depreciation and amortization minus interest expense scaled by book equity.
Relative return: A measure of the return of one investment relative to another.
Small cap stocks: Stocks with a relatively small market capitalization.
Tercile: One of three equal-sized groups created by dividing a ranked dataset into thirds.
Index Descriptions
The Dimensional indices represent academic concepts that may be used in portfolio construction and are not available for direct investment or for use as a benchmark. Index returns are not representative of actual portfolios and do not reflect costs and fees associated with an actual investment.
The Dimensional indices have been retrospectively calculated by Dimensional Fund Advisors LP and did not exist prior to their index inception dates. Accordingly, results shown during the periods prior to each index’s inception date do not represent actual returns of the index. Other periods selected may have different results, including losses. Backtested index performance is hypothetical and is provided for informational purposes only to indicate historical performance had the index been calculated over the relevant time periods. Backtested performance results assume the reinvestment of dividends and capital gains.
Dimensional US Small Cap Index was created by Dimensional in March 2007 and is compiled by Dimensional. June 1927–December 1974: Market-capitalization-weighted index of securities of the smallest US companies whose market capitalization falls in the lowest 8% of the total market capitalization of the eligible market. The eligible market is composed of securities of US companies traded on the NYSE, NYSE MKT (formerly AMEX), and Nasdaq Global Market. Exclusions: non-US companies, REITs, UITs, and investment companies. Source: CRSP and Compustat. January 1975–present: Market-capitalization-weighted index of securities of the smallest US companies whose market capitalization falls in the lowest 8% of the total market capitalization of the eligible market. The eligible market is composed of securities of US companies traded on the NYSE, NYSE MKT (formerly AMEX), and Nasdaq Global Market. Exclusions: non-US companies, REITs, UITs, and investment companies, and companies with the lowest profitability and highest relative price within the small cap universe. The index also excludes those companies with the highest asset growth within the small cap universe. Source: CRSP and Compustat. The index monthly returns are computed as the simple average of the monthly returns of 12 subindices, each one reconstituted once a year at the end of each month of the year. The calculation methodology for the index was amended in January 2014 to include profitability as a factor in selecting securities for inclusion in the index. The calculation methodology for the index was amended in December 2019 to include asset growth as a factor in selecting securities for inclusion in the index.
Dimensional US Small Growth Low Profitability Index was created in February 2016 and is compiled by Dimensional. January 1975–present: Consists of small cap securities in the eligible markets with the lowest profitability and highest relative price within their country’s small cap universe, after the exclusion of utilities and companies with either negative or missing relative price data. The eligible market is composed of securities of US companies traded on the NYSE, NYSE MKT (formerly AMEX), and Nasdaq Global Market. Exclusions: non-US companies, REITs, UITs, and investment companies. Source: CRSP and Compustat. The index monthly returns are computed as the simple average of the monthly returns of 12 subindices, each one reconstituted once a year at the end of each month of the year.
Dimensional US Small High Asset Growth Index was created by Dimensional in December 2019 and is compiled by Dimensional. January 1975–present: Consists of small cap securities in the eligible markets with the highest asset growth within their country’s small cap universe. The eligible market is composed of securities of US companies traded on the NYSE, NYSE MKT (formerly AMEX), and Nasdaq Global Market. Exclusions: non-US companies, REITs, UITs, and investment companies. Source: CRSP and Compustat. The index monthly returns are computed as the simple average of the monthly returns of 12 subindices, each one reconstituted once a year at the end of each month of the year.
Disclosures
US-domiciled mutual funds are not generally available for distribution outside the US.
The information in this material is intended for the recipient’s background information and use only. It is provided in good faith and without any warranty or representation as to accuracy or completeness. Information and opinions presented in this material have been obtained or derived from sources believed by Dimensional to be reliable, and Dimensional has reasonable grounds to believe that all factual information herein is true as at the date of this material. It does not constitute investment advice, a recommendation, or an offer of any services or products for sale and is not intended to provide a sufficient basis on which to make an investment decision. Before acting on any information in this document, you should consider whether it is appropriate for your particular circumstances and, if appropriate, seek professional advice. It is the responsibility of any persons wishing to make a purchase to inform themselves of and observe all applicable laws and regulations. Unauthorized reproduction or transmission of this material is strictly prohibited. Dimensional accepts no responsibility for loss arising from the use of the information contained herein.
This material is not directed at any person in any jurisdiction where the availability of this material is prohibited or would subject Dimensional or its products or services to any registration, licensing, or other such legal requirements within the jurisdiction.
“Dimensional” refers to the Dimensional separate but affiliated entities generally, rather than to one particular entity. These entities are Dimensional Fund Advisors LP, Dimensional Fund Advisors Ltd., Dimensional Ireland Limited, DFA Australia Limited, Dimensional Fund Advisors Canada ULC, Dimensional Fund Advisors Pte. Ltd., Dimensional Japan Ltd., and Dimensional Hong Kong Limited.
Indices are not available for direct investment; therefore, their performance does not reflect the expenses associated with the management of an actual portfolio. Frank Russell Company is the source and owner of the trademarks, service marks, and copyrights related to the Russell Indexes.
RISKS
Investments involve risks. The investment return and principal value of an investment may fluctuate so that an investor’s shares, when redeemed, may be worth more or less than their original value. Past performance is not a guarantee of future results. There is no guarantee strategies will be successful.
Small cap securities are subject to greater volatility than those in other asset categories.
CANADA
These materials have been prepared by Dimensional Fund Advisors Canada ULC. The other Dimensional entities referenced herein are not registered resident investment fund managers or portfolio managers in Canada.
This material is not intended for Quebec residents.
Commissions, trailing commissions, management fees, and expenses all may be associated with mutual fund investments. Please read the prospectus before investing. Unless otherwise noted, any indicated total rates of return reflect the historical annual compounded total returns, including changes in share or unit value and reinvestment of all dividends or other distributions, and do not take into account sales, redemption, distribution, or optional charges or income taxes payable by any security holder that would have reduced returns. Mutual funds are not guaranteed, their values change frequently, and past performance may not be repeated.
Resources