Weighing In on Equal Weights
Equal-weighting reduces big-stock concentration but strays far from market prices, increases trading and taxes—making it a questionable fix for diversification.


Investors wary of exposure to the largest US stocks have sought novel ways to lessen how much they hold. One popular recent solution is equal-weighted versions of indices, such as the S&P 500. As the name suggests, this scheme targets every stock in the underlying index in equal amounts, as opposed to in proportion to market capitalization. But is this really an improvement?
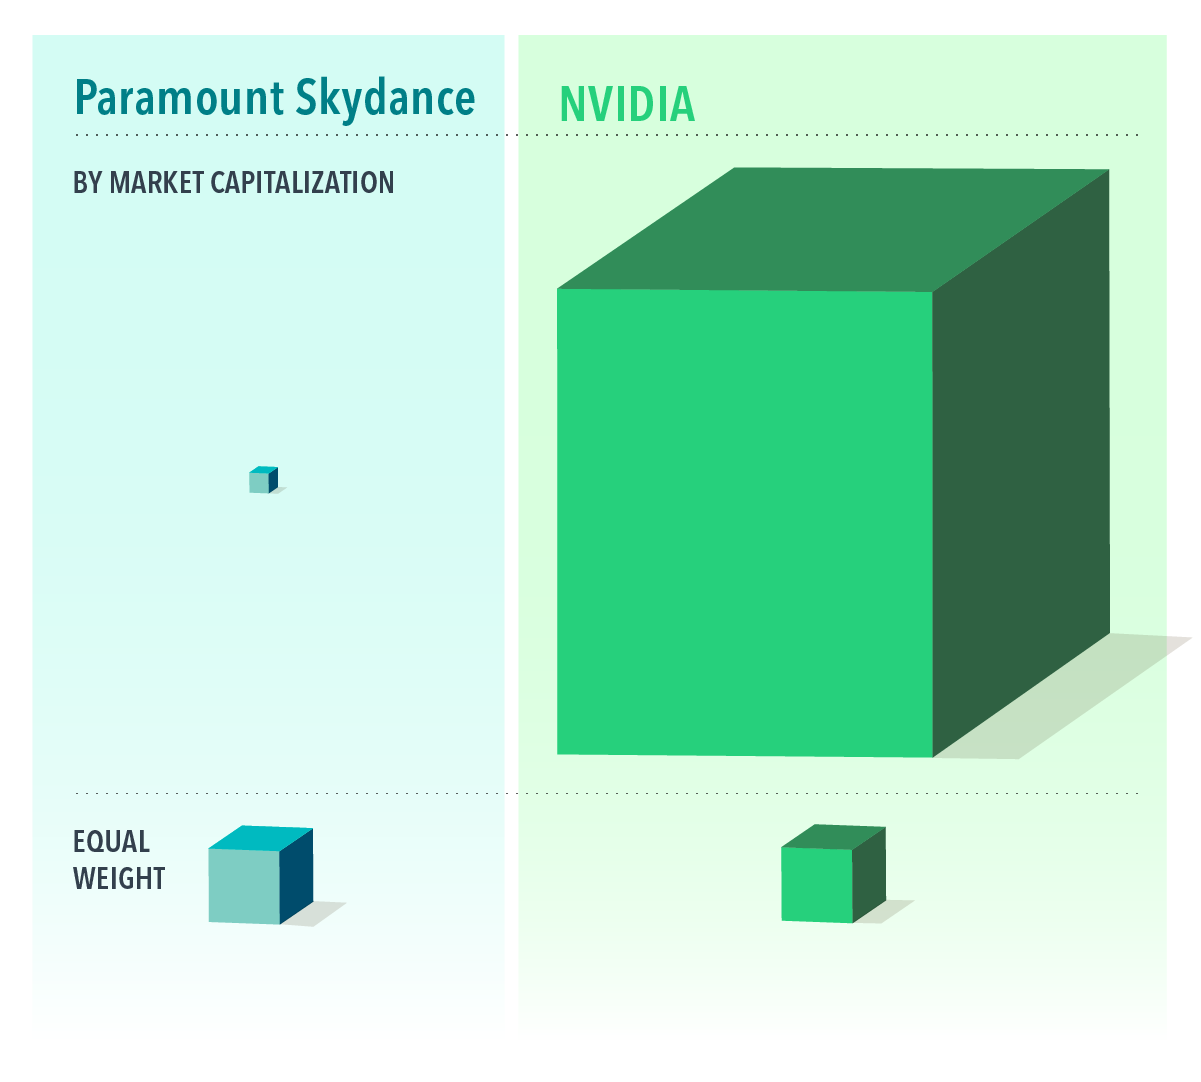
Equal weighting produces drastic deviations from market weights. The 10 largest stocks in the S&P 500 account for over 38% of the cap-weighted index but only about 2% in the equally weighted version.1 As dramatic as that sounds, it’s what happens with smaller constituents that’s eye-popping. For example, NVIDIA’s capitalization weight is more than 1,300 times that of the index’s lowest cap-weighted constituent, Paramount Skydance. And yet equal weighting invests the same amount in both. This is roughly equivalent to a global stock portfolio allocating the same amount to the United States as to Peru.2 Or, in noninvestment terms, using the Burj Khalifa tower and a toddler interchangeably as height references.
Given that market cap weights are based on prices that reflect the market’s aggregate outlook, it’s worth considering whether it makes sense to deviate so much from the market’s combined wisdom.
Equal weighting can also increase the amount of trading for a portfolio. Unlike market cap weights that effectively self-rebalance when stock prices change, true equal weighting requires continual trading to restore identical weights across holdings. More trading means more costs for a portfolio.
Another cost likely amplified by equal weighting is taxes. Real estate investment trusts (REITs) account for about 1.7% of the S&P 500 by market weight.3 That would be more than three times higher with equal weights. Given the dividend income distributed by REITs is nonqualified, equal weighting may drive up an investor’s tax bill.
Reducing concentration in the largest stocks or increasing expected returns through emphasizing smaller companies is a sensible objective. It’s just that equal weighting might not be the right tool for the job. A more reasonable approach is to use a scheme that links security weights to market capitalization and deviates based on size, relative price, and profitability characteristics. This can check both of those boxes without the drawbacks of equal weighting.
EXHIBIT 1
Company Weight in the S&P 500 Index
Footnotes
1. As of January 31, 2026. There were 503 stocks in the S&P 500 Index, which means each one would be 0.2% of the equally weighted index.
2. Based on country weights of the MSCI All Country World Index as of January 31, 2026. Peru has three stocks, by the way.
3. As of January 31, 2026.
Glossary
Expected returns: An estimate of average anticipated returns informed by historical data.
Market capitalization: The total value of all shares of a company’s stock, calculated by multiplying the price of a stock by its total number of outstanding shares.
Nonqualified dividend income: Income taxed at ordinary income rates. Qualified dividend income is taxed at lower capital gains rates.
Profitability: A company’s operating income before depreciation and amortization minus interest expense scaled by book equity.
Relative price: A company’s price, or the market value of its equity, in relation to another measure of economic value, such as book value.
Disclosures
Named securities may be held in accounts managed by Dimensional.
The information in this material is intended for the recipient’s background information and use only. It is provided in good faith and without any warranty or representation as to accuracy or completeness. Information and opinions presented in this material have been obtained or derived from sources believed by Dimensional to be reliable, and Dimensional has reasonable grounds to believe that all factual information herein is true as at the date of this material. It does not constitute investment advice, a recommendation, or an offer of any services or products for sale and is not intended to provide a sufficient basis on which to make an investment decision. Before acting on any information in this document, you should consider whether it is appropriate for your particular circumstances and, if appropriate, seek professional advice. It is the responsibility of any persons wishing to make a purchase to inform themselves of and observe all applicable laws and regulations. Unauthorized reproduction or transmission of this material is strictly prohibited. Dimensional accepts no responsibility for loss arising from the use of the information contained herein.
This material is not directed at any person in any jurisdiction where the availability of this material is prohibited or would subject Dimensional or its products or services to any registration, licensing, or other such legal requirements within the jurisdiction.
“Dimensional” refers to the Dimensional separate but affiliated entities generally, rather than to one particular entity. These entities are Dimensional Fund Advisors LP, Dimensional Fund Advisors Ltd., Dimensional Ireland Limited, DFA Australia Limited, Dimensional Fund Advisors Canada ULC, Dimensional Fund Advisors Pte. Ltd., Dimensional Japan Ltd., and Dimensional Hong Kong Limited.
RISKS
Investments involve risks. The investment return and principal value of an investment may fluctuate so that an investor’s shares, when redeemed, may be worth more or less than their original value. Past performance is not a guarantee of future results. There is no guarantee strategies will be successful.
CANADA
These materials have been prepared by Dimensional Fund Advisors Canada ULC. The other Dimensional entities referenced herein are not registered resident investment fund managers or portfolio managers in Canada.
This material is not intended for Quebec residents.
Commissions, trailing commissions, management fees, and expenses all may be associated with mutual fund investments. Please read the prospectus before investing. Unless otherwise noted, any indicated total rates of return reflect the historical annual compounded total returns, including changes in share or unit value and reinvestment of all dividends or other distributions, and do not take into account sales, redemption, distribution, or optional charges or income taxes payable by any security holder that would have reduced returns. Mutual funds are not guaranteed, their values change frequently, and past performance may not be repeated.
Resources


