US Market Not Partying Like It’s 1999
High US valuations reflect strong profitability growth, not just market optimism, making comparisons to the late 1990s misleading and future returns less predic


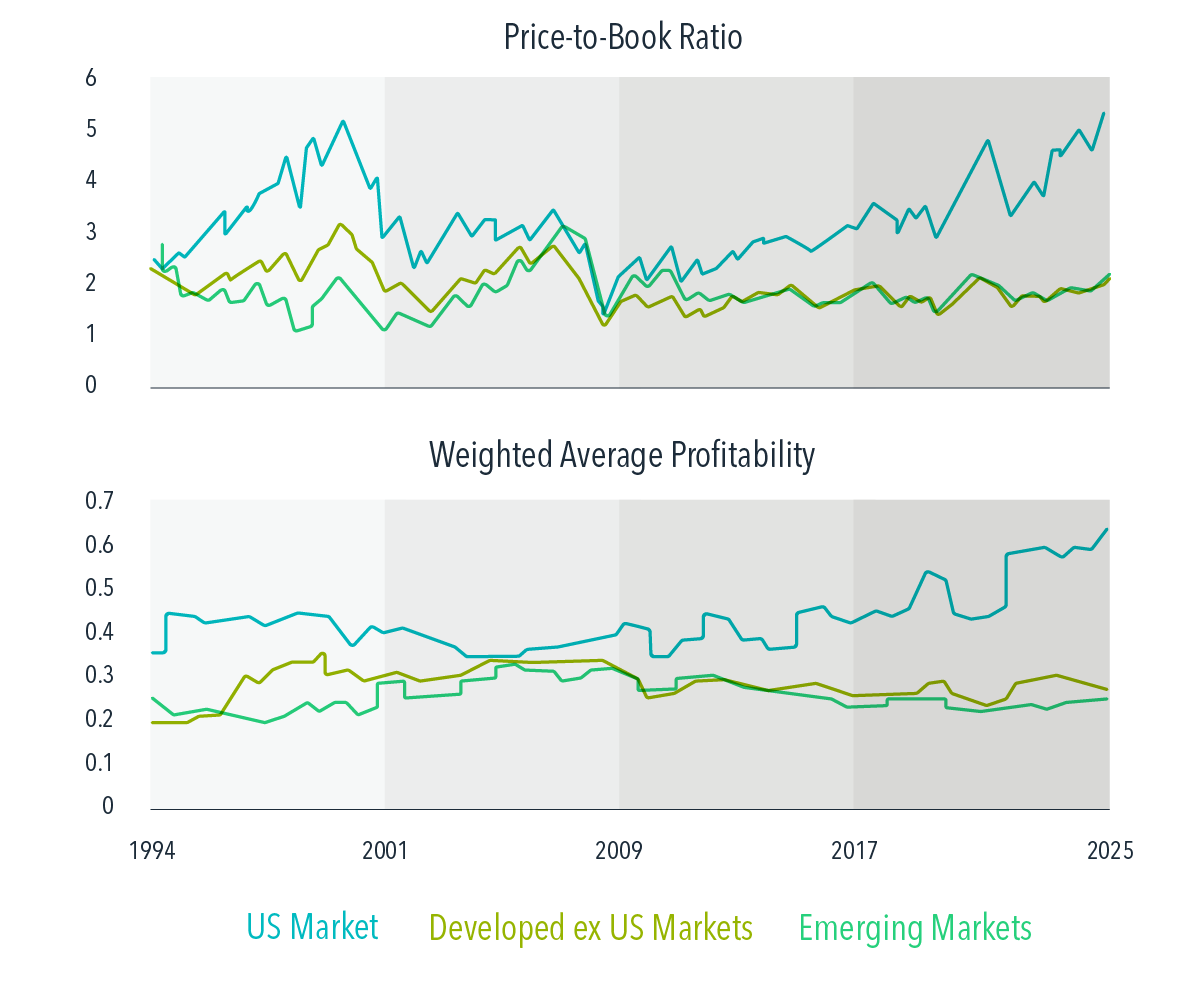
Much has been made of current US stock market valuations. As of November 30, the aggregate price-to-book ratio of the US market was 5.21—more than double the valuations of non-US developed and emerging market stocks. Many observers have drawn parallels to the late 1990s, when the gap between US and non-US valuations was similarly wide. Some view this as an omen for future returns—and not a good one given the US market’s infamous “lost decade” starting in 2000.
But this comparison may not be apples to apples. The weighted average profitability of the US market has surged in recent years, rising from 42% five years ago to 62% as of November 30. That’s a very different backdrop from 1999, when US market profitability declined over the subsequent five years.
Valuation ratios can be high because expected returns are low or because expected future earnings growth is high. There is no evidence that investors can reliably disentangle these effects in real time. But the strong profitability growth of recent years suggests a more nuanced story behind today’s US valuations. It is not clear that the US market requires poor future returns in order to “grow into” its current valuation levels.
Exhibit 1
Regional Equity Market Characteristics
January 1994–November 2025
Glossary
Aggregate price-to-book ratio: The ratio of a firm’s market value to its book value, where market value is computed as price multiplied by shares outstanding, and book value is the value of stockholder equity as reported on a company’s balance sheet.
Profitability: A company’s operating income before depreciation and amortization minus interest expense scaled by book equity.
Index Descriptions
Fama/French Total US Market Research Index: July 1926–present: Fama/French Total US Market Research Factor + One-Month US Treasury Bills.
Fama/French International Market Index: January 1975–present: Fama/French International Market Index. Simulated from MSCI and Bloomberg data.
Fama/French Emerging Markets Index: July 1989–present: Fama/French Emerging Markets Index. Courtesy of Fama/French from Bloomberg and IFC securities data. Companies weighted by float-adjusted market cap; rebalanced annually in June.
Eugene Fama and Ken French are members of the Board of Directors of the general partner of, and provide consulting services to, Dimensional Fund Advisors LP.
Disclosures
The information in this material is intended for the recipient’s background information and use only. It is provided in good faith and without any warranty or representation as to accuracy or completeness. Information and opinions presented in this material have been obtained or derived from sources believed by Dimensional to be reliable, and Dimensional has reasonable grounds to believe that all factual information herein is true as at the date of this material. It does not constitute investment advice, a recommendation, or an offer of any services or products for sale and is not intended to provide a sufficient basis on which to make an investment decision. Before acting on any information in this document, you should consider whether it is appropriate for your particular circumstances and, if appropriate, seek professional advice. It is the responsibility of any persons wishing to make a purchase to inform themselves of and observe all applicable laws and regulations. Unauthorized reproduction or transmission of this material is strictly prohibited. Dimensional accepts no responsibility for loss arising from the use of the information contained herein.
This material is not directed at any person in any jurisdiction where the availability of this material is prohibited or would subject Dimensional or its products or services to any registration, licensing, or other such legal requirements within the jurisdiction.
“Dimensional” refers to the Dimensional separate but affiliated entities generally, rather than to one particular entity. These entities are Dimensional Fund Advisors LP, Dimensional Fund Advisors Ltd., Dimensional Ireland Limited, DFA Australia Limited, Dimensional Fund Advisors Canada ULC, Dimensional Fund Advisors Pte. Ltd., Dimensional Japan Ltd., and Dimensional Hong Kong Limited.
RISKS
Investments involve risks. The investment return and principal value of an investment may fluctuate so that an investor’s shares, when redeemed, may be worth more or less than their original value. Past performance is not a guarantee of future results. There is no guarantee strategies will be successful.
CANADA
These materials have been prepared by Dimensional Fund Advisors Canada ULC. The other Dimensional entities referenced herein are not registered resident investment fund managers or portfolio managers in Canada.
This material is not intended for Quebec residents.
Commissions, trailing commissions, management fees, and expenses all may be associated with mutual fund investments. Please read the prospectus before investing. Unless otherwise noted, any indicated total rates of return reflect the historical annual compounded total returns, including changes in share or unit value and reinvestment of all dividends or other distributions, and do not take into account sales, redemption, distribution, or optional charges or income taxes payable by any security holder that would have reduced returns. Mutual funds are not guaranteed, their values change frequently, and past performance may not be repeated.
Resources