Stop, Drop, and Stay the Course
Market downturns are common but often temporary. Like fire drills, preparing in advance helps investors stay calm and remain invested during volatility.


For many of us, the importance of a fire drill is ingrained starting as early as elementary school. The procedure of reacting to an alarm by calmly exiting the building is repeated to build muscle memory for what to do in a real emergency. Just as importantly, it cements lessons on what not to do. For example, I don’t think the saying goes: “Stop, drop, and grab a coffee before riding in the elevator.”
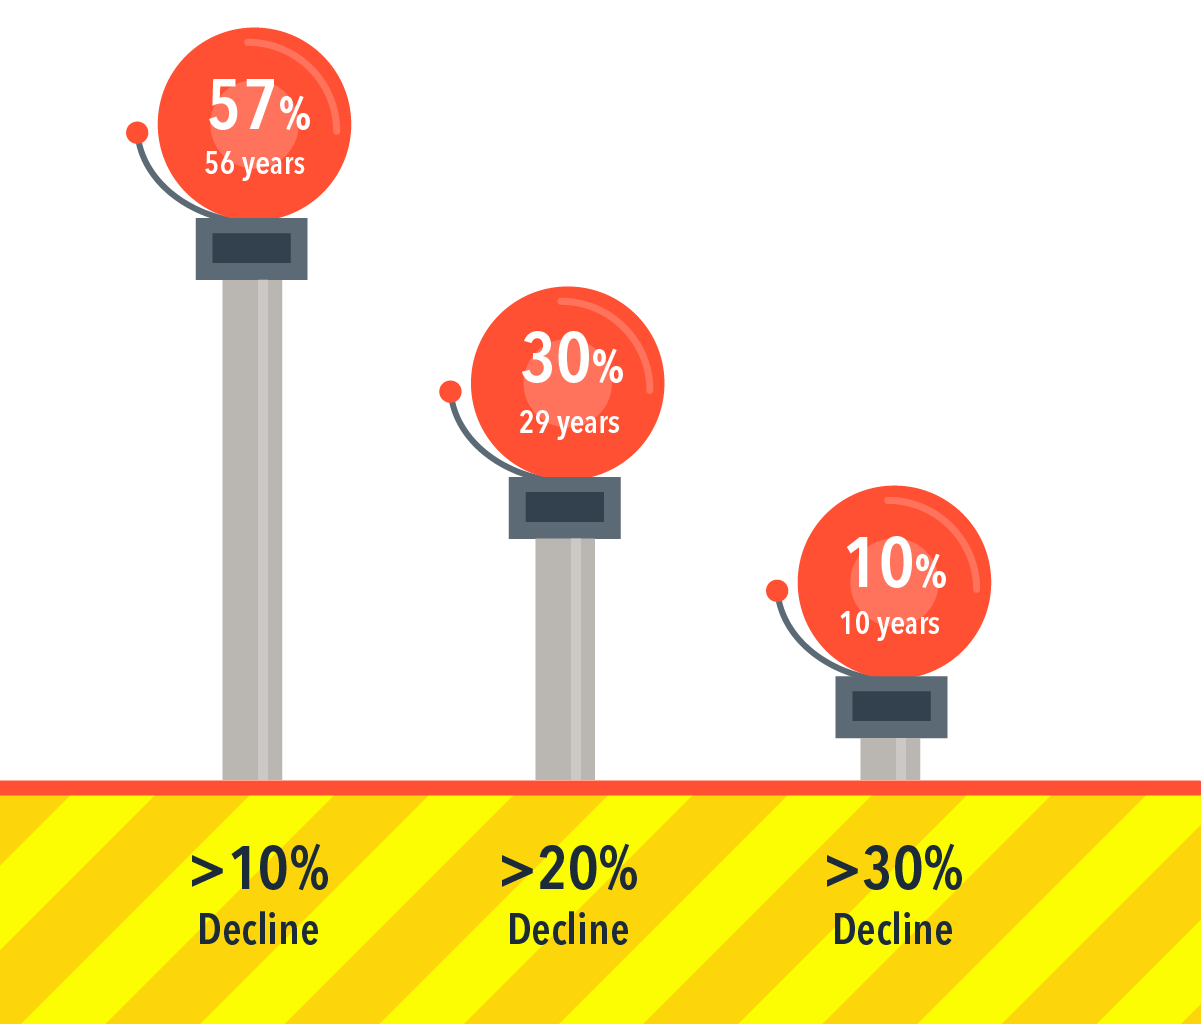
The concept of a fire drill is relevant to investing too. Knowing the range of possible outcomes, and how to behave in those circumstances, is critical to success for the long-term investor. The odds are that investors will be tested with a downturn. US stocks have experienced a downturn of at least 20% at some point during 29 of 98 calendar years since 1927.
It’s important to keep in mind that a bad stretch doesn’t mean a bad year to come. While a 20% slide occurred in 29 years, only six times did the market end up below −20% for the full year. And the market actually posted positive full-year returns in 10 of those 29 years. This reinforces the lesson that the most reliable course of action following a market downturn is to remain invested.
We can’t control—or predict—market drops. What we can do is avoid compounding losses by reacting. Fire drills save lives. Financial fire drills may help save our savings.
EXHIBIT 1
Frequency of Declines for the US Stock Market, 1927–2024
Index Descriptons
Fama/French Total US Market Research Index: July 1926–present: Fama/French Total US Market Research Factor + One-Month US Treasury Bills. Source: Ken French website.
Results shown during periods prior to each index’s inception date do not represent actual returns of the respective index. Other periods selected may have different results, including losses. Backtested index performance is hypothetical and is provided for informational purposes only to indicate historical performance had the index been calculated over the relevant time periods. Backtested performance results assume the reinvestment of dividends and capital gains. Profitability is measured as operating income before depreciation and amortization minus interest expense scaled by book. Eugene Fama and Ken French are members of the Board of Directors of the general partner of, and provide consulting services to, Dimensional Fund Advisors LP.
Disclosures
The information in this material is intended for the recipient’s background information and use only. It is provided in good faith and without any warranty or representation as to accuracy or completeness. Information and opinions presented in this material have been obtained or derived from sources believed by Dimensional to be reliable, and Dimensional has reasonable grounds to believe that all factual information herein is true as at the date of this material. It does not constitute investment advice, a recommendation, or an offer of any services or products for sale and is not intended to provide a sufficient basis on which to make an investment decision. Before acting on any information in this document, you should consider whether it is appropriate for your particular circumstances and, if appropriate, seek professional advice. It is the responsibility of any persons wishing to make a purchase to inform themselves of and observe all applicable laws and regulations. Unauthorized reproduction or transmission of this material is strictly prohibited. Dimensional accepts no responsibility for loss arising from the use of the information contained herein.
This material is not directed at any person in any jurisdiction where the availability of this material is prohibited or would subject Dimensional or its products or services to any registration, licensing, or other such legal requirements within the jurisdiction.
“Dimensional” refers to the Dimensional separate but affiliated entities generally, rather than to one particular entity. These entities are Dimensional Fund Advisors LP, Dimensional Fund Advisors Ltd., Dimensional Ireland Limited, DFA Australia Limited, Dimensional Fund Advisors Canada ULC, Dimensional Fund Advisors Pte. Ltd., Dimensional Japan Ltd., and Dimensional Hong Kong Limited. Dimensional Hong Kong Limited is licensed by the Securities and Futures Commission to conduct Type 1 (dealing in securities) regulated activities only and does not provide asset management services.
RISKS
Investments involve risks. The investment return and principal value of an investment may fluctuate so that an investor’s shares, when redeemed, may be worth more or less than their original value. Past performance is not a guarantee of future results. There is no guarantee strategies will be successful.
CANADA
These materials have been prepared by Dimensional Fund Advisors Canada ULC. The other Dimensional entities referenced herein are not registered resident investment fund managers or portfolio managers in Canada.
This material is not intended for Quebec residents.
Commissions, trailing commissions, management fees, and expenses all may be associated with mutual fund investments. Please read the prospectus before investing. Unless otherwise noted, any indicated total rates of return reflect the historical annual compounded total returns, including changes in share or unit value and reinvestment of all dividends or other distributions, and do not take into account sales, redemption, distribution, or optional charges or income taxes payable by any security holder that would have reduced returns. Mutual funds are not guaranteed, their values change frequently, and past performance may not be repeated.
Resources