Quarterly Review: Stocks Hit Fresh Highs, and the Fed Makes a Cut
S&P 500 & Nasdaq hit records as Fed cut rates; small caps led, value lagged. Meme stocks sank, but diversification and discipline proved resilient.


KEY TAKEAWAYS
- The broad market S&P 500 and tech-heavy Nasdaq both hit record highs in September.
- The Fed lowered interest rates, by a quarter point, for the first time since December 2024.
- Small cap stocks outpaced large caps in the US and globally, but value lagged growth.
Stocks extended gains in the third quarter, with major indices in the US hitting new records, including the S&P 500 and Nasdaq, as trade negotiations proceeded and the US Federal Reserve cut interest rates.1 The rate reduction in September was the first in nearly a year. Stocks’ rise was a continuation of the gains that have proceeded for much of 2025, aside from the market’s sharp fall and quick recovery during a volatile April. Developed international equities lagged the US in the third quarter, but emerging markets were higher, and both remained ahead of the US for the year. In the bond market, US Treasuries were slightly higher, with the benchmark 10-year yield just above 4%.2
The Fed cut the federal-funds rate by 25 basis points to a range between 4%–4.25% in September, the first move lower since December.3 In August, the US core consumer price index, which excludes more-volatile food and energy items, was shown rising 3.1% from a year ago.4 That’s above the Fed’s target rate of 2%. The Fed’s September rate cut came with officials referencing their two goals of keeping inflation and unemployment in check but noting that “downside risks to employment have risen.”
Trade negotiations between the United States and other countries continued during the quarter, with the US administration reaching a number of trade deals, including with the European Union, the United Kingdom, and Japan. But questions remained about levies that may be imposed on goods from China, India, Mexico, and elsewhere.5 In the coming months, the US Supreme Court is also set to weigh in on a case to determine the validity of global tariffs that have been imposed by the current administration.6
Against this backdrop, US stocks advanced, with the S&P 500 Index rising 7.7% and the tech-heavy Nasdaq adding 11.3% as of September 19. Shares of NVIDIA stood out as the firm became the first public company to reach a market capitalization of $4 trillion, making it nearly 8% of the S&P 500 Index.7 Global equities, as measured by the MSCI All Country World Index, rose 7.2% as of September 19, trailing the US. Developed international stocks outside the US added 4.8%, as measured by the MSCI World ex USA Index. The MSCI Emerging Markets Index gained 10.2%.8
Small cap stocks beat large caps in the US and globally through September 19, with US small caps having some of their best returns in recent years.9 Value stocks, or those with low relative prices, did not rise as much as growth stocks in the US and globally. High profitability stocks were outpaced by low profitability stocks in global developed markets as of September 19, while the opposite was true in emerging markets, with high profitability stocks beating their low profitability counterparts.10
In the bond market, US Treasuries were 1.5% higher, sending the yield on the benchmark 10-year Treasury down to 4.14%.11 The broader bond market also gained, with the Bloomberg US Aggregate Bond Index up 2.1% and the Bloomberg Global Aggregate Bond Index (hedged to USD)—a broad benchmark of sovereign and corporate debt—adding 1.2% as of September 19.12
Risky Business
Investors chased gains in a number of notable meme stocks in the third quarter.13 But meme investing is just another form of stock picking. History suggests such tactics rarely pay off: Those who try to pick winners generally lose to the broad market. As Exhibit 1 shows, investors pursuing outsize returns through meme stocks may be risking outsize declines. From January 1, 2021, to September 19, 2025, several notable meme stocks had declines that were far greater than what the S&P 500 experienced.
EXHIBIT 1
See What I Meme?
Meme stocks of 2021, maximum drawdown, January 1, 2021–September 19, 2025
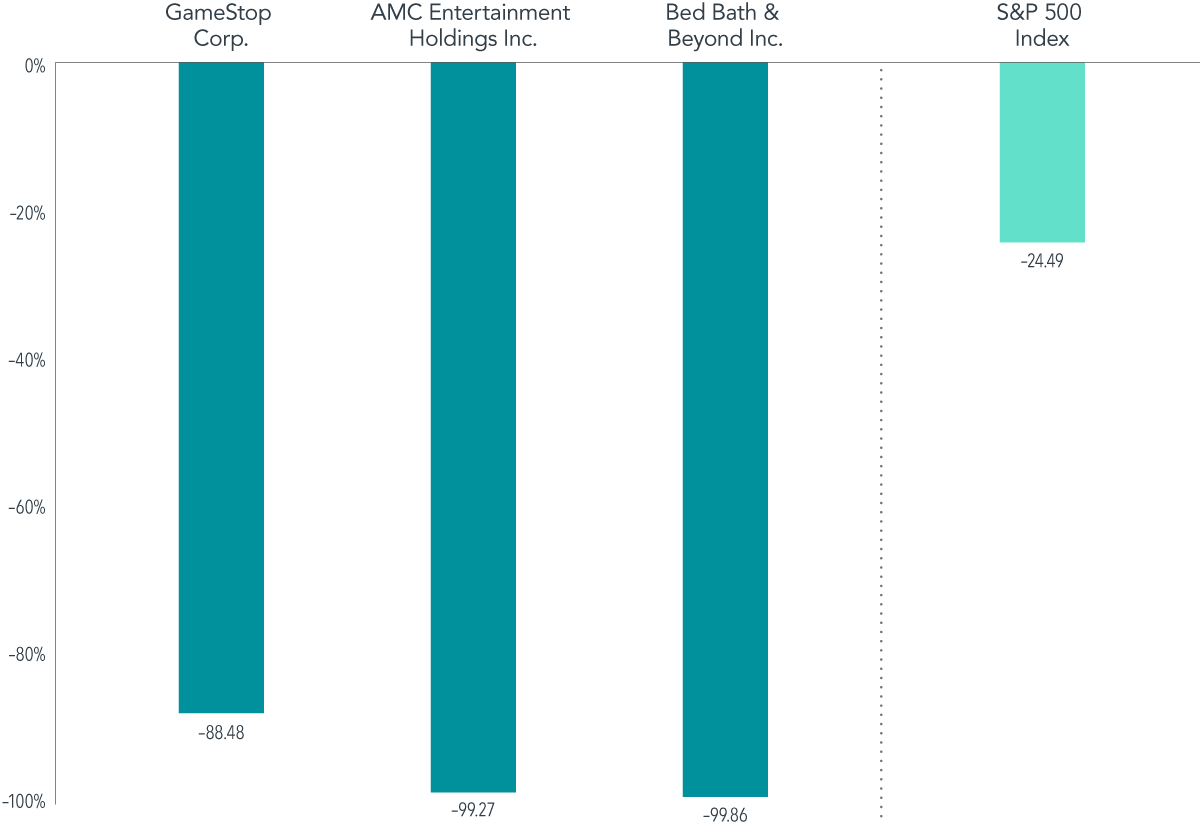
Examining how meme stocks have fared since the phenomenon began nearly five years ago can provide a reminder to investors to take caution. By holding a diversified portfolio, investors can often get exposure to meme stocks while being more likely to capture broad market returns and limit individual stock risk.
Focus and Fortitude
With questions swirling about geopolitical events and other concerns as we enter the fourth quarter, uncertainty remains about the impact they may have for investors. But it’s worth remembering that, over the decades, investors have experienced an array of challenges, including extreme inflation, financial crises, and other global shocks. Markets have consistently demonstrated their resilience, continually adjusting to new information and rewarding discipline over time. Taking a broad perspective and investing for the long run means weathering events that may cause market turmoil. Having a broadly diversified portfolio, a sound financial plan, and the discipline to stay committed to it has been a reliable way to capture markets’ long-term growth potential.
Index descriptions
Fama/French Developed High Profitability Index: July 1990–Present: Fama/French Developed High Profitability Index. Courtesy of Fama/French from Bloomberg securities data. Includes stocks in the upper 30% operating profitability range in each region; companies weighted by float-adjusted market cap; rebalanced annually in June. OP for June of year t is annual revenues minus cost of goods sold; interest expense; and selling, general, and administrative expenses; divided by book equity for the last fiscal year end in t – 1. Fama/French and multifactor data provided by Fama/French.
Fama/French Developed Low Profitability Index: July 1990–Present: Fama/French Developed Low Profitability Index. Courtesy of Fama/French from Bloomberg securities data. Includes stocks in the lower 30% operating profitability range in each region; companies weighted by float-adjusted market cap; rebalanced annually in June. OP for June of year t is annual revenues minus cost of goods sold; interest expense; and selling, general, and administrative expenses; divided by book equity for the last fiscal year end in t – 1. Fama/French and multifactor data provided by Fama/French.
Fama/French Emerging Markets High Profitability Index: July 1991–Present: Fama/French Emerging Markets High Profitability Index. Courtesy of Fama/French from Bloomberg and IFC securities data. Includes stocks in the upper 30% operating profitability range in each country; companies weighted by float-adjusted market cap; rebalanced annually in June. OP for June of year t is annual revenues minus cost of goods sold; interest expense; and selling, general, and administrative expenses; divided by book equity for the last fiscal year end in t – 1. Fama/French and multifactor data provided by Fama/French.
Fama/French Emerging Markets Low Profitability Index: July 1991–Present: Fama/French Emerging Markets Low Profitability Index. Courtesy of Fama/French from Bloomberg and IFC securities data. Includes stocks in the lower 30% operating profitability range in each country; companies weighted by float-adjusted market cap; rebalanced annually in June. OP for June of year t is annual revenues minus cost of goods sold; interest expense; and selling, general, and administrative expenses; divided by book equity for the last fiscal year end in t – 1. Fama/French and multifactor data provided by Fama/French.
Results shown during periods prior to each index’s inception date do not represent actual returns of the respective index. Other periods selected may have different results, including losses. Backtested index performance is hypothetical and is provided for informational purposes only to indicate historical performance had the index been calculated over the relevant time periods. Backtested performance results assume the reinvestment of dividends and capital gains. Profitability is measured as operating income before depreciation and amortization minus interest expense scaled by book. Eugene Fama and Ken French are members of the Board of Directors of the general partner of, and provide consulting services to, Dimensional Fund Advisors LP.
Footnotes
- S&P data © 2025 S&P Dow Jones Indices LLC, a division of S&P Global. All rights reserved. Data as of September 19, 2025. Indices are not available for direct investment. Connor Smith, “Stocks Hit New Records in a Rate Cut Rally,” Barron’s, September 18, 2025.
- Returns are based on the Bloomberg US Treasury Bond Index as of September 19, 2025. Bloomberg data is provided by Bloomberg Finance LP. Source for US Treasuries: US Department of the Treasury.
- The federal-funds rate is the overnight interest rate at which one depository institution (like a bank) lends to another institution some of its funds that are held at the Federal Reserve. Source: “Federal Reserve Issues FOMC Statement,” US Federal Reserve, September 17, 2025; Colby Smith, "Fed Cuts Rates for First Time this Year," The New York Times, September 17, 2025.
- Inflation data is as defined by the consumer price index from the US Bureau of Labor Statistics; the core CPI is an aggregate of prices paid by urban consumers for a typical basket of goods, excluding food and energy; Colby Smith, “Rise in US Inflation Is Likely to Keep Fed Cautious on Pace of Rate Cuts,” The New York Times, September 11, 2025; Colby Smith, "Fed Cuts Rates for First Time this Year," The New York Times, September 17, 2025.
- Chao Deng and Drew An-Pham, “Trump’s Tariffs: Where He Started, What He Threatened, Where He Ended Up,” The Wall Street Journal, August 27, 2025.
- Louise Radnofsky, “Supreme Court Agrees to Fast-Track Trump’s Tariff Appeal,” The Wall Street Journal, September 9, 2025.
- Jeff Sommer, “How Long Can This Uncanny Stock Market Prosper?” The New York Times, August 22, 2025. This information should not be considered a recommendation to buy or sell a particular security. Named securities may be held in accounts managed by Dimensional. It should not be assumed that an investment in the securities identified was or would be profitable.
- MSCI data © MSCI 2025, all rights reserved. Data as of September 19, 2025. Indices are not available for direct investment.
- Jacob Sonenshine, “Small-Cap Stocks Are on a Roll. What Could Push Them Higher.” Barron’s, September 10, 2025.
- The MSCI All Country World Value Index rose 5.6%, while the MSCI All Country World Growth Index rose 8.7% as of September 19, 2025; the MSCI All Country World Small Cap Index advanced 8.5%, while the larger-cap MSCI All Country World Index rose 7.2% as of September 19, 2025; the Russell 2000 Index of US small cap stocks returned 12.9% through September 19, 2025; Frank Russell Company is the source and owner of the trademarks, service marks, and copyrights related to the Russell Indexes; the Fama/French Developed High Profitability Index rose 7.4% versus 9.1% for its low profitability counterpart as of September 19, 2025; the Fama/French Emerging Markets High Profitability Index rose 11.8%, and its low profitability counterpart rose 8.7% as of September 19, 2025. See “Index Descriptions” for descriptions of the Fama/French index data. Past performance is no guarantee of future results. Actual returns may be lower. The Fama/French indices represent academic concepts that may be used in portfolio construction and are not available for direct investment or for use as a benchmark. Index returns are not representative of actual portfolios and do not reflect costs and fees associated with an actual investment.
- “Daily Treasury Par Yield Curve Rates,” US Department of the Treasury. Data as of September 19, 2025.
- Bloomberg data provided by Bloomberg Finance LP.
- Lisa Kailai Han, “How July’s Meme Stock Surge Compares to 2021—Still a Long Way to Go,” CNBC, July 23, 2025.
Disclosures
Past performance is not a guarantee of future results. Indices are not available for direct investment.
Their performance does not reflect the expenses associated with the management of an actual portfolio.
The information in this material is intended for the recipient’s background information and use only. It is provided in good faith and without any warranty or representation as to accuracy or completeness. Information and opinions presented in this material have been obtained or derived from sources believed by Dimensional to be reliable, and Dimensional has reasonable grounds to believe that all factual information herein is true as at the date of this material. It does not constitute investment advice, a recommendation, or an offer of any services or products for sale and is not intended to provide a sufficient basis on which to make an investment decision. Before acting on any information in this document, you should consider whether it is appropriate for your particular circumstances and, if appropriate, seek professional advice. It is the responsibility of any persons wishing to make a purchase to inform themselves of and observe all applicable laws and regulations. Unauthorized reproduction or transmission of this material is strictly prohibited. Dimensional accepts no responsibility for loss arising from the use of the information contained herein.
This material is not directed at any person in any jurisdiction where the availability of this material is prohibited or would subject Dimensional or its products or services to any registration, licensing, or other such legal requirements within the jurisdiction.
“Dimensional” refers to the Dimensional separate but affiliated entities generally, rather than to one particular entity. These entities are Dimensional Fund Advisors LP, Dimensional Fund Advisors Ltd., Dimensional Ireland Limited, DFA Australia Limited, Dimensional Fund Advisors Canada ULC, Dimensional Fund Advisors Pte. Ltd., Dimensional Japan Ltd., and Dimensional Hong Kong Limited. Dimensional Hong Kong Limited is licensed by the Securities and Futures Commission to conduct Type 1 (dealing in securities) regulated activities only and does not provide asset management services.
RISKS
Investments involve risks. The investment return and principal value of an investment may fluctuate so that an investor’s shares, when redeemed, may be worth more or less than their original value. Past performance is not a guarantee of future results. There is no guarantee strategies will be successful.
CANADA
These materials have been prepared by Dimensional Fund Advisors Canada ULC. The other Dimensional entities referenced herein are not registered resident investment fund managers or portfolio managers in Canada.
This material is not intended for Quebec residents.
Commissions, trailing commissions, management fees, and expenses all may be associated with mutual fund investments. Please read the prospectus before investing. Unless otherwise noted, any indicated total rates of return reflect the historical annual compounded total returns, including changes in share or unit value and reinvestment of all dividends or other distributions, and do not take into account sales, redemption, distribution, or optional charges or income taxes payable by any security holder that would have reduced returns. Mutual funds are not guaranteed, their values change frequently, and past performance may not be repeated.
Resources