Magnificent Expectations
Strong stock returns often reflect companies exceeding expectations. With higher forecasts for the Magnificent 7 in 2026, outperforming may be harder.


Market prices reflect what investors expect to happen in the future. When a group of stocks delivers returns far above the broad stock market, it’s likely these companies surprised investors in a good way.
This principle is challenging to uncover in the data because the market’s expectations are hard to quantify, even with the benefit of hindsight. Sure, we can compare a company’s reported earnings against what was forecast by analysts. But there’s dispersion in analysts’ forecasts. And sometimes earnings reports are accompanied by messaging from the company about its future business that impacts prices. So, a company can beat its earnings forecast and still experience a price decline.
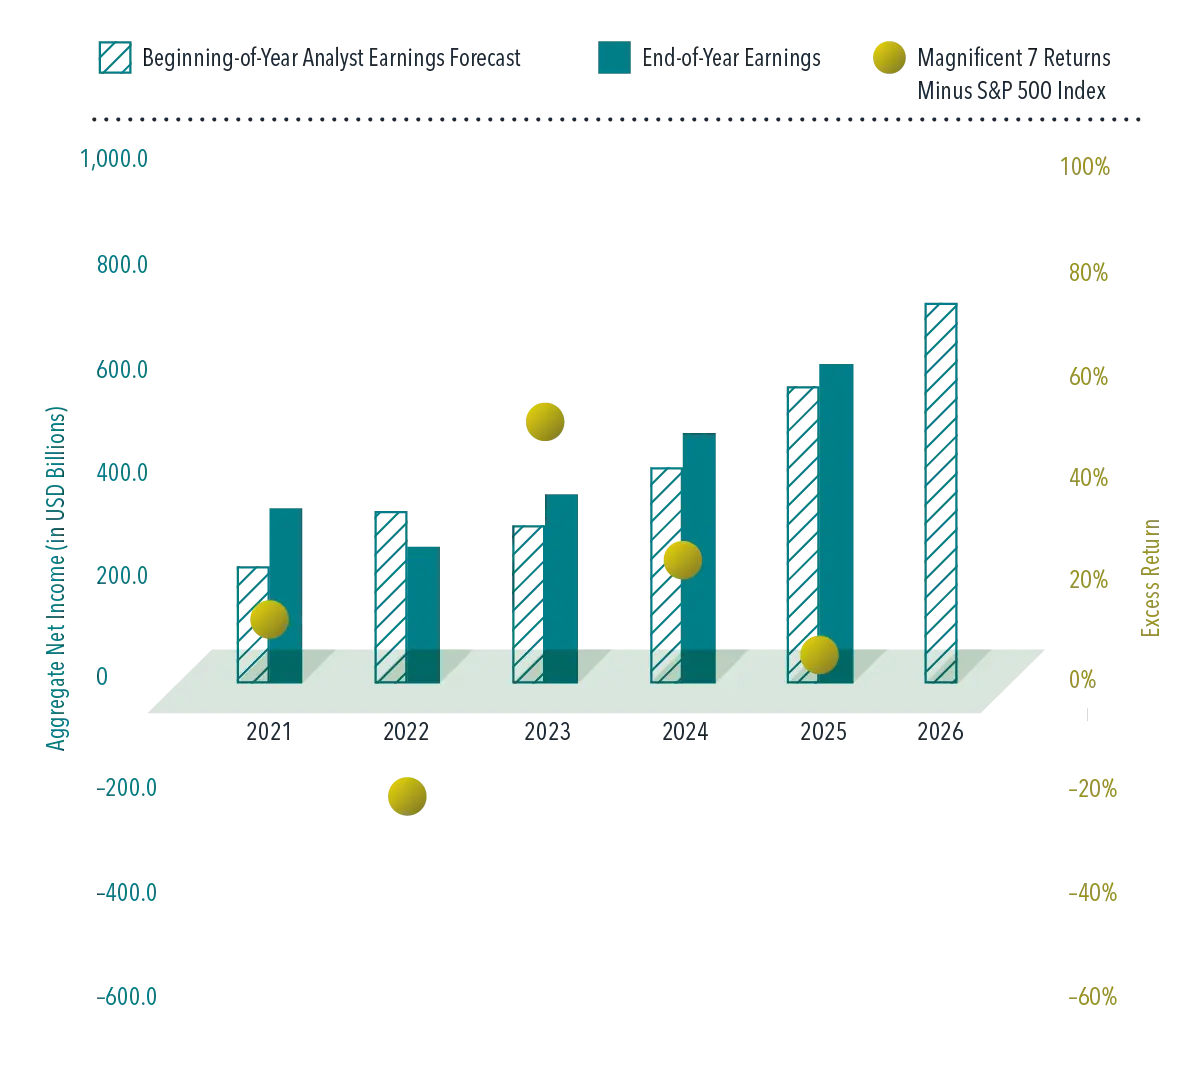
All that said, sometimes we see strong indicators of earnings surprises. Recent years for the Magnificent 7 stocks are a good example. From 2021 through 2025, aggregate earnings for these companies exceeded average beginning-of-year expectations in all but one year, 2022. Their stocks outpaced the broad market in all but one year. I bet you can guess which year they underperformed.
Obviously, we don’t yet have 2026 results. But forecasted earnings for the Mag 7 are even higher this year. That means a potentially higher bar these companies must clear such that they can deliver outsized returns.
EXHIBIT 1
Magnificent 7 Earnings vs. Beginning of Year Forecasts, 2021–2026
Disclosures
The information in this material is intended for the recipient’s background information and use only. It is provided in good faith and without any warranty or representation as to accuracy or completeness. Information and opinions presented in this material have been obtained or derived from sources believed by Dimensional to be reliable, and Dimensional has reasonable grounds to believe that all factual information herein is true as at the date of this material. It does not constitute investment advice, a recommendation, or an offer of any services or products for sale and is not intended to provide a sufficient basis on which to make an investment decision. Before acting on any information in this document, you should consider whether it is appropriate for your particular circumstances and, if appropriate, seek professional advice. It is the responsibility of any persons wishing to make a purchase to inform themselves of and observe all applicable laws and regulations. Unauthorized reproduction or transmission of this material is strictly prohibited. Dimensional accepts no responsibility for loss arising from the use of the information contained herein.
This material is not directed at any person in any jurisdiction where the availability of this material is prohibited or would subject Dimensional or its products or services to any registration, licensing, or other such legal requirements within the jurisdiction.
“Dimensional” refers to the Dimensional separate but affiliated entities generally, rather than to one particular entity. These entities are Dimensional Fund Advisors LP, Dimensional Fund Advisors Ltd., Dimensional Ireland Limited, DFA Australia Limited, Dimensional Fund Advisors Canada ULC, Dimensional Fund Advisors Pte. Ltd., Dimensional Japan Ltd., and Dimensional Hong Kong Limited.
RISKS
Investments involve risks. The investment return and principal value of an investment may fluctuate so that an investor’s shares, when redeemed, may be worth more or less than their original value. Past performance is not a guarantee of future results. There is no guarantee strategies will be successful.
CANADA
These materials have been prepared by Dimensional Fund Advisors Canada ULC. The other Dimensional entities referenced herein are not registered resident investment fund managers or portfolio managers in Canada.
This material is not intended for Quebec residents.
Commissions, trailing commissions, management fees, and expenses all may be associated with mutual fund investments. Please read the prospectus before investing. Unless otherwise noted, any indicated total rates of return reflect the historical annual compounded total returns, including changes in share or unit value and reinvestment of all dividends or other distributions, and do not take into account sales, redemption, distribution, or optional charges or income taxes payable by any security holder that would have reduced returns. Mutual funds are not guaranteed, their values change frequently, and past performance may not be repeated.
Resources