inCAPEable
The CAPE ratio ended 2025 near a 25-year high, but that doesn’t mean it’s time to turn bearish on stocks


The cyclically adjusted price-to-earnings (CAPE) ratio1 is often referenced by market pundits making bearish calls on stocks. Some believe this market valuation is inversely related to future market returns, meaning when it’s high, expected returns are low. Given the CAPE ended 2025 at 39.9, the highest it’s been in a quarter century, many in the market forecasting business see dark clouds ahead for stocks.
Investor fixation on the CAPE ratio is often fueled by charts plotting real (inflation-adjusted) 10-year stock returns against the start-of-period CAPE ratios. When plotted using monthly data, a negative relation between the two seems evident. However, there are flaws with this interpretation.
The first issue is that the return observations cover 10 years but are plotted monthly. That means points in Exhibit 1 are not independent observations—back-to-back data points share 119 of 120 monthly returns. It’s very hard to identify a reliable relation between two variables when the one you’re predicting has so much overlap between observations.
EXHIBIT 1
CAPE Ratio at Each Month-End vs. Real US Stock Returns over the Next 10 Year
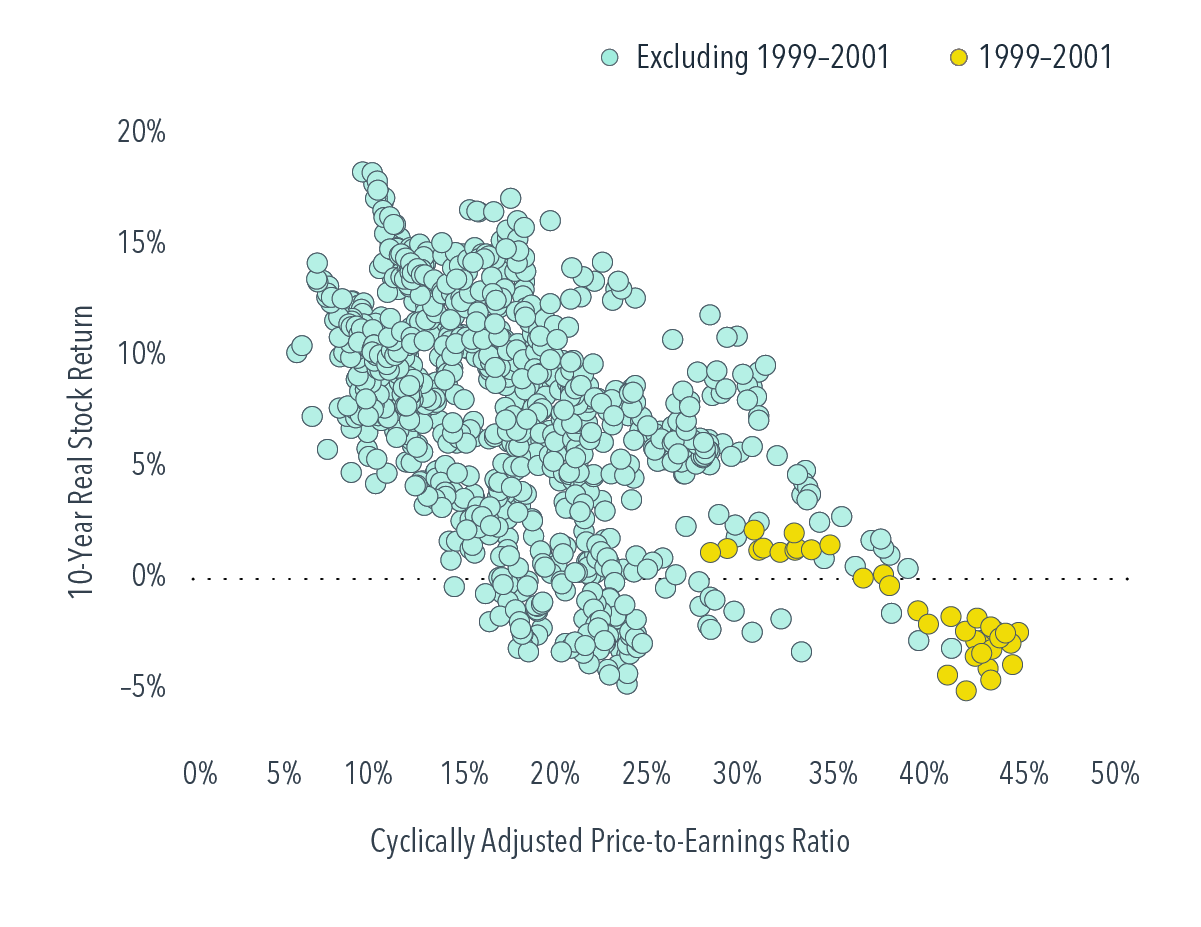
Compounding the overlap issue is that many of the previous extreme CAPE readings (i.e., those above 35) took place between 1999 and 2001. So, we’ve got essentially one data point that just so happens to precede the disappointing 2000–2009 period for US stocks. Not very helpful for informing what we should expect of markets when the CAPE gets so high.
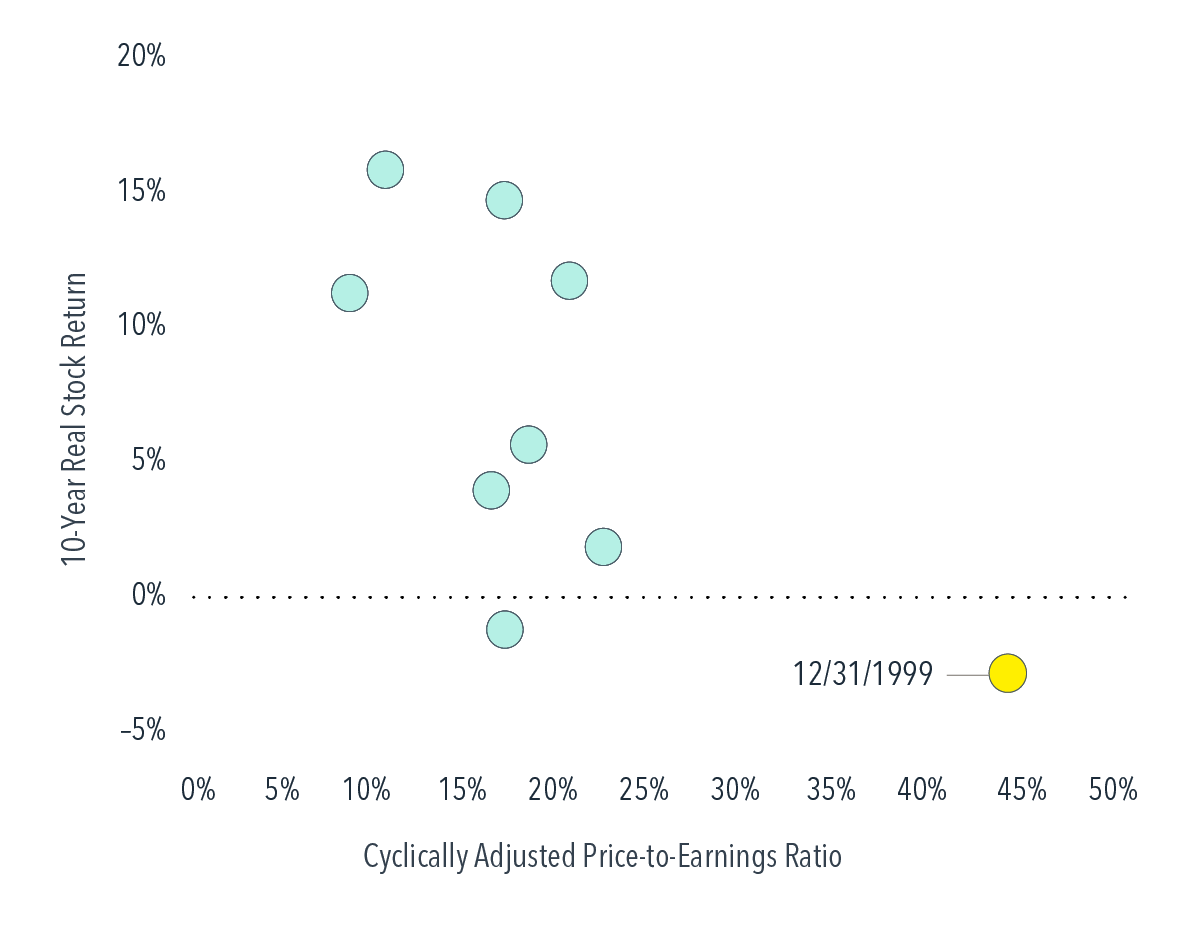
One way around the overlap issue is to use CAPE data at intervals that match the subsequent return horizon. Exhibit 2 below plots CAPE ratios at the end of each decade versus subsequent 10-year real returns. Now, the relation between CAPE and future stock performance looks much weaker. The late ’90s cluster of high CAPEs, captured by the December 1999 observation, clearly stands as an outlier.
Another reason for skepticism over dire predictions: The CAPE has been high for years, hitting 35 back in January 2021. Many pundits were predicting market declines back then. We have to wait a while longer to see the 10-year real return from that point, but the first five years have not exactly been rough sledding. The US market is up almost 49% net of inflation since then.2
Nobody knows what the future holds for markets. We’ve written recently about how high valuations today might be different from those of the late ’90s. Regardless, it’s advisable to tune out bearish predictions based solely on the CAPE.
EXHIBIT 2
CAPE Ratio at the End of Each Decade vs. Real US Stock Returns over the Next 10 Years
Footnotes
1. The CAPE ratio is calculated by taking the average of earnings for the past 10 years, adjusted for inflation. Data for this ratio are available on economist Robert Shiller’s website: www.econ.yale.edu/~shiller/data.htm.
2. In USD. Real return from January 1, 2021, to November 30, 2025, calculated as the Fama/French Total US Market Research Index return in excess of the change in the US consumer price index.
Glossary
Expected return: An estimate of average anticipated returns informed by historical data.
Real return: A return in excess of inflation.
Index Descriptions
Fama/French Total US Market Research Index: July 1926–present: Fama/French Total US Market Research Factor + One-Month US Treasury Bills. Source: Ken French website.
Results shown during periods prior to each index’s inception date do not represent actual returns of the respective index. Other periods selected may have different results, including losses. Backtested index performance is hypothetical and is provided for informational purposes only to indicate historical performance had the index been calculated over the relevant time periods. Backtested performance results assume the reinvestment of dividends and capital gains. Profitability is measured as operating income before depreciation and amortization minus interest expense scaled by book. Eugene Fama and Ken French are members of the Board of Directors of the general partner of, and provide consulting services to, Dimensional Fund Advisors LP.
Disclosures
The information in this material is intended for the recipient’s background information and use only. It is provided in good faith and without any warranty or representation as to accuracy or completeness. Information and opinions presented in this material have been obtained or derived from sources believed by Dimensional to be reliable, and Dimensional has reasonable grounds to believe that all factual information herein is true as at the date of this material. It does not constitute investment advice, a recommendation, or an offer of any services or products for sale and is not intended to provide a sufficient basis on which to make an investment decision. Before acting on any information in this document, you should consider whether it is appropriate for your particular circumstances and, if appropriate, seek professional advice. It is the responsibility of any persons wishing to make a purchase to inform themselves of and observe all applicable laws and regulations. Unauthorized reproduction or transmission of this material is strictly prohibited. Dimensional accepts no responsibility for loss arising from the use of the information contained herein.
This material is not directed at any person in any jurisdiction where the availability of this material is prohibited or would subject Dimensional or its products or services to any registration, licensing, or other such legal requirements within the jurisdiction.
“Dimensional” refers to the Dimensional separate but affiliated entities generally, rather than to one particular entity. These entities are Dimensional Fund Advisors LP, Dimensional Fund Advisors Ltd., Dimensional Ireland Limited, DFA Australia Limited, Dimensional Fund Advisors Canada ULC, Dimensional Fund Advisors Pte. Ltd., Dimensional Japan Ltd., and Dimensional Hong Kong Limited.
RISKS
Investments involve risks. The investment return and principal value of an investment may fluctuate so that an investor’s shares, when redeemed, may be worth more or less than their original value. Past performance is not a guarantee of future results. There is no guarantee strategies will be successful.
CANADA
These materials have been prepared by Dimensional Fund Advisors Canada ULC. The other Dimensional entities referenced herein are not registered resident investment fund managers or portfolio managers in Canada.
This material is not intended for Quebec residents.
Commissions, trailing commissions, management fees, and expenses all may be associated with mutual fund investments. Please read the prospectus before investing. Unless otherwise noted, any indicated total rates of return reflect the historical annual compounded total returns, including changes in share or unit value and reinvestment of all dividends or other distributions, and do not take into account sales, redemption, distribution, or optional charges or income taxes payable by any security holder that would have reduced returns. Mutual funds are not guaranteed, their values change frequently, and past performance may not be repeated.
Resources