Financial Reporting Frequency and Market Premiums
A Dimensional study examines whether reporting frequency affects key investment premiums—including market, size, value, and profitability—across global markets.


KEY TAKEAWAYS
- The US Securities and Exchange Commission has proposed allowing public companies to choose between quarterly and semiannual financial reporting.
- Allowing companies to choose a reduced reporting frequency could lower companies’ costs but could also raise concerns over information gaps due to reliance on older data.
- An examination of a diverse set of reporting environments shows no discernible pattern to premium performance.
One of the key features of public equity markets is the requirement for the provision of timely and accurate financial data to market participants. However, the “ideal” frequency of that data remains a point of contention—US public companies are currently required to report quarterly, while in other markets, the required reporting frequency varies. While market transparency is undoubtedly important, it should be balanced against the cost borne by publicly traded companies.
This tradeoff is particularly relevant today as the US Securities and Exchange Commission has proposed to allow public companies that are subject to reporting obligations under the Securities Exchange Act of 1934 to choose between quarterly and semiannual reporting. Companies will likely consider many factors when determining whether to report on a quarterly or semiannual basis, such as compliance costs, the nature of their business model, alignment with industry peers, and investor expectations. For investors, an essential question is how reduced reporting frequency may affect the equity, size, value, and profitability premiums. Since reporting regulations have varied over time and across countries, we studied the potential impact by examining the US market over different periods and comparing global markets that have different reporting frequencies.
The US Historical Perspective
The US has not always been a quarterly reporting market. Historically, mandated annual reporting ruled until 1955, followed by semiannual reporting until 1969. The current quarterly mandate began in 1970. Mandatory reporting requires companies to disclose core financial statements, including the balance sheet, income statement, and cash-flow statement. Unlike annual reports, the interim filings are only subject to a limited review rather than a full audit. While a full audit requires rigorous verification of assets and bank records, a limited review relies on high-level analytical procedures and management inquiries, allowing for timely financial updates while maintaining professional oversight.
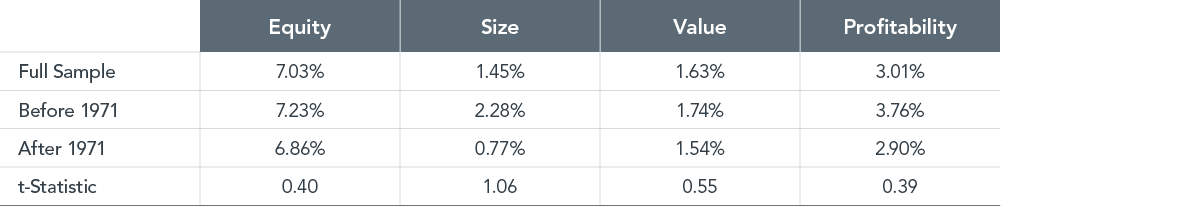
If reporting frequency were a key driver of market premiums, we would expect to see structural shifts across these periods. However, as shown in Exhibit 1, while average premiums fluctuate, the differences across reporting regimes are not statistically reliable.1
EXHIBIT 1
Average Annual US Market Premiums, July 1926–December 2025
Global Evidence: Markets with Quarterly vs. Semiannual Requirements
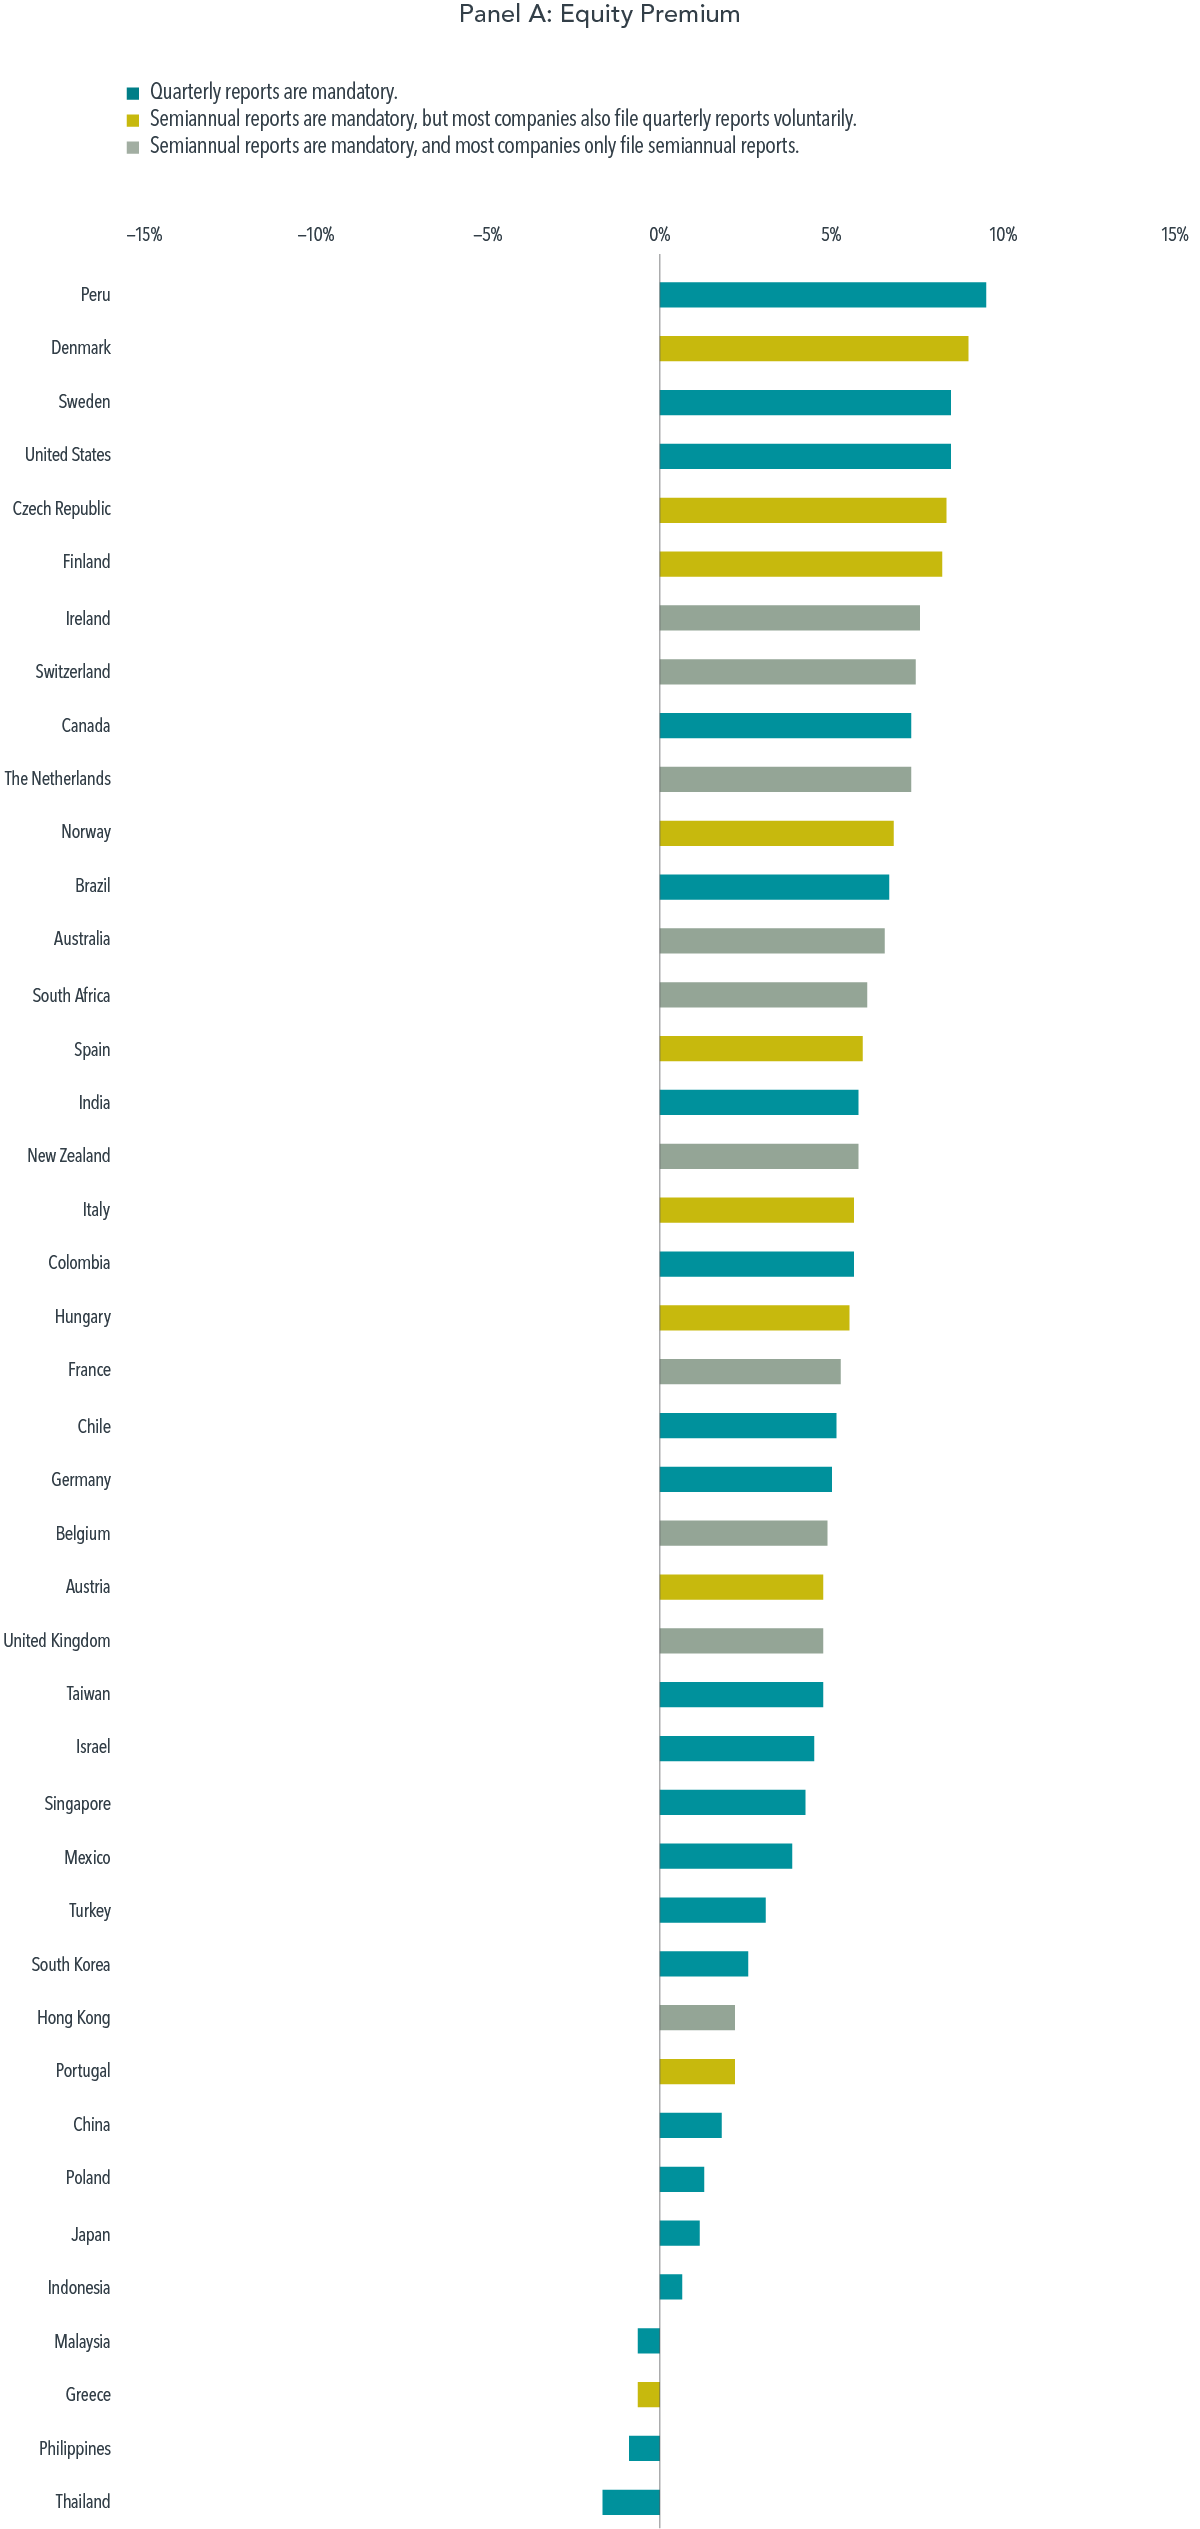
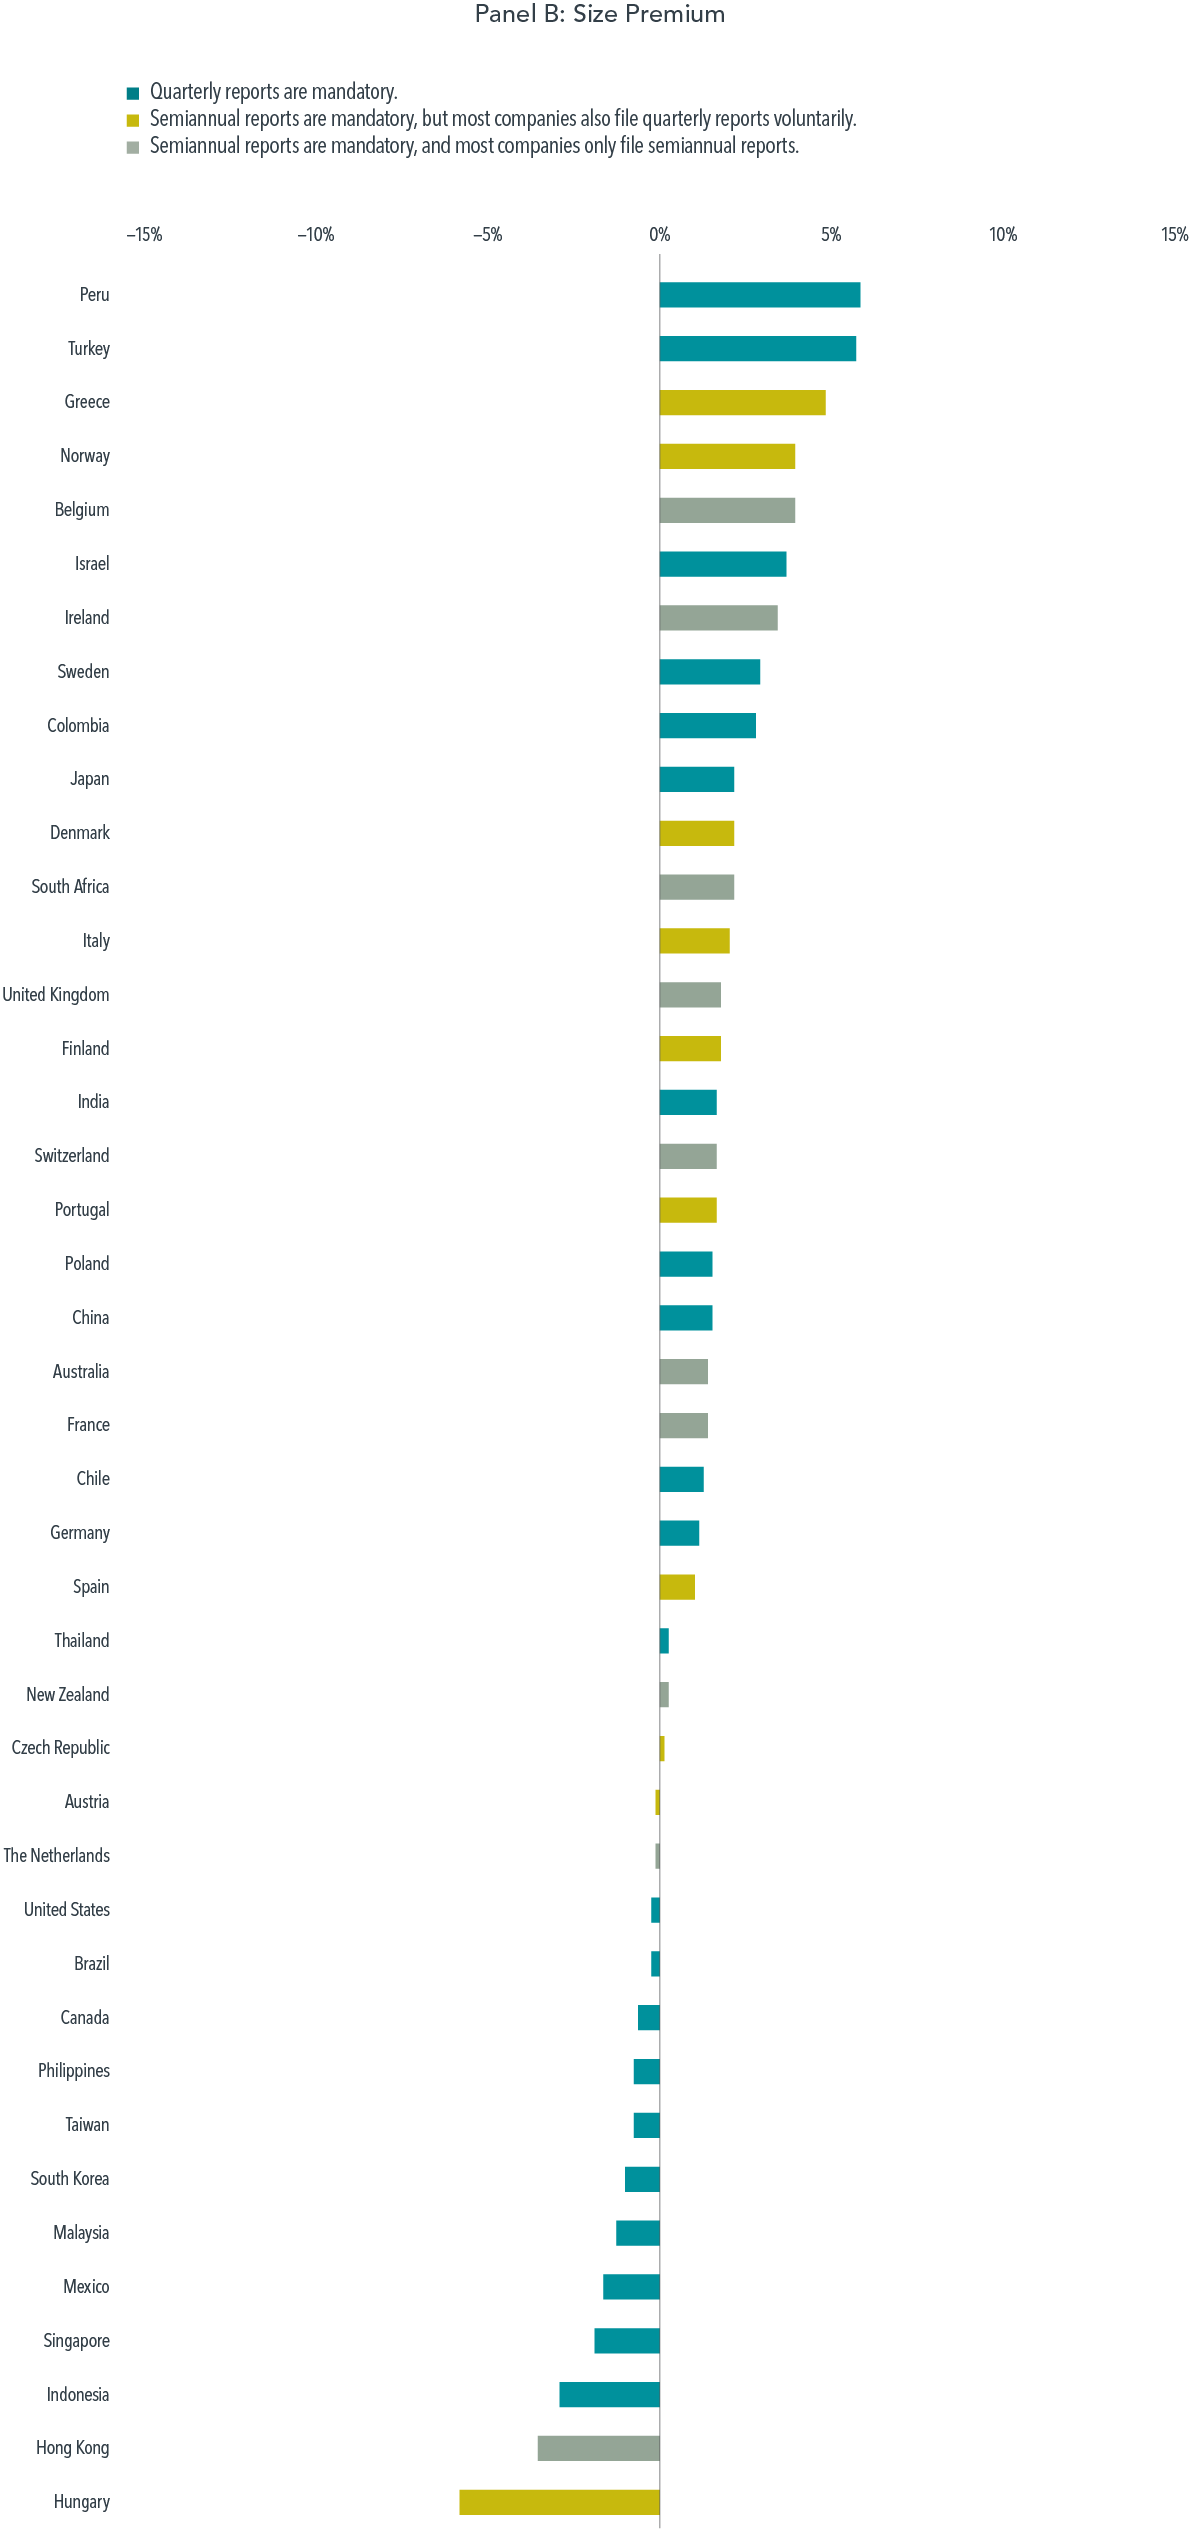
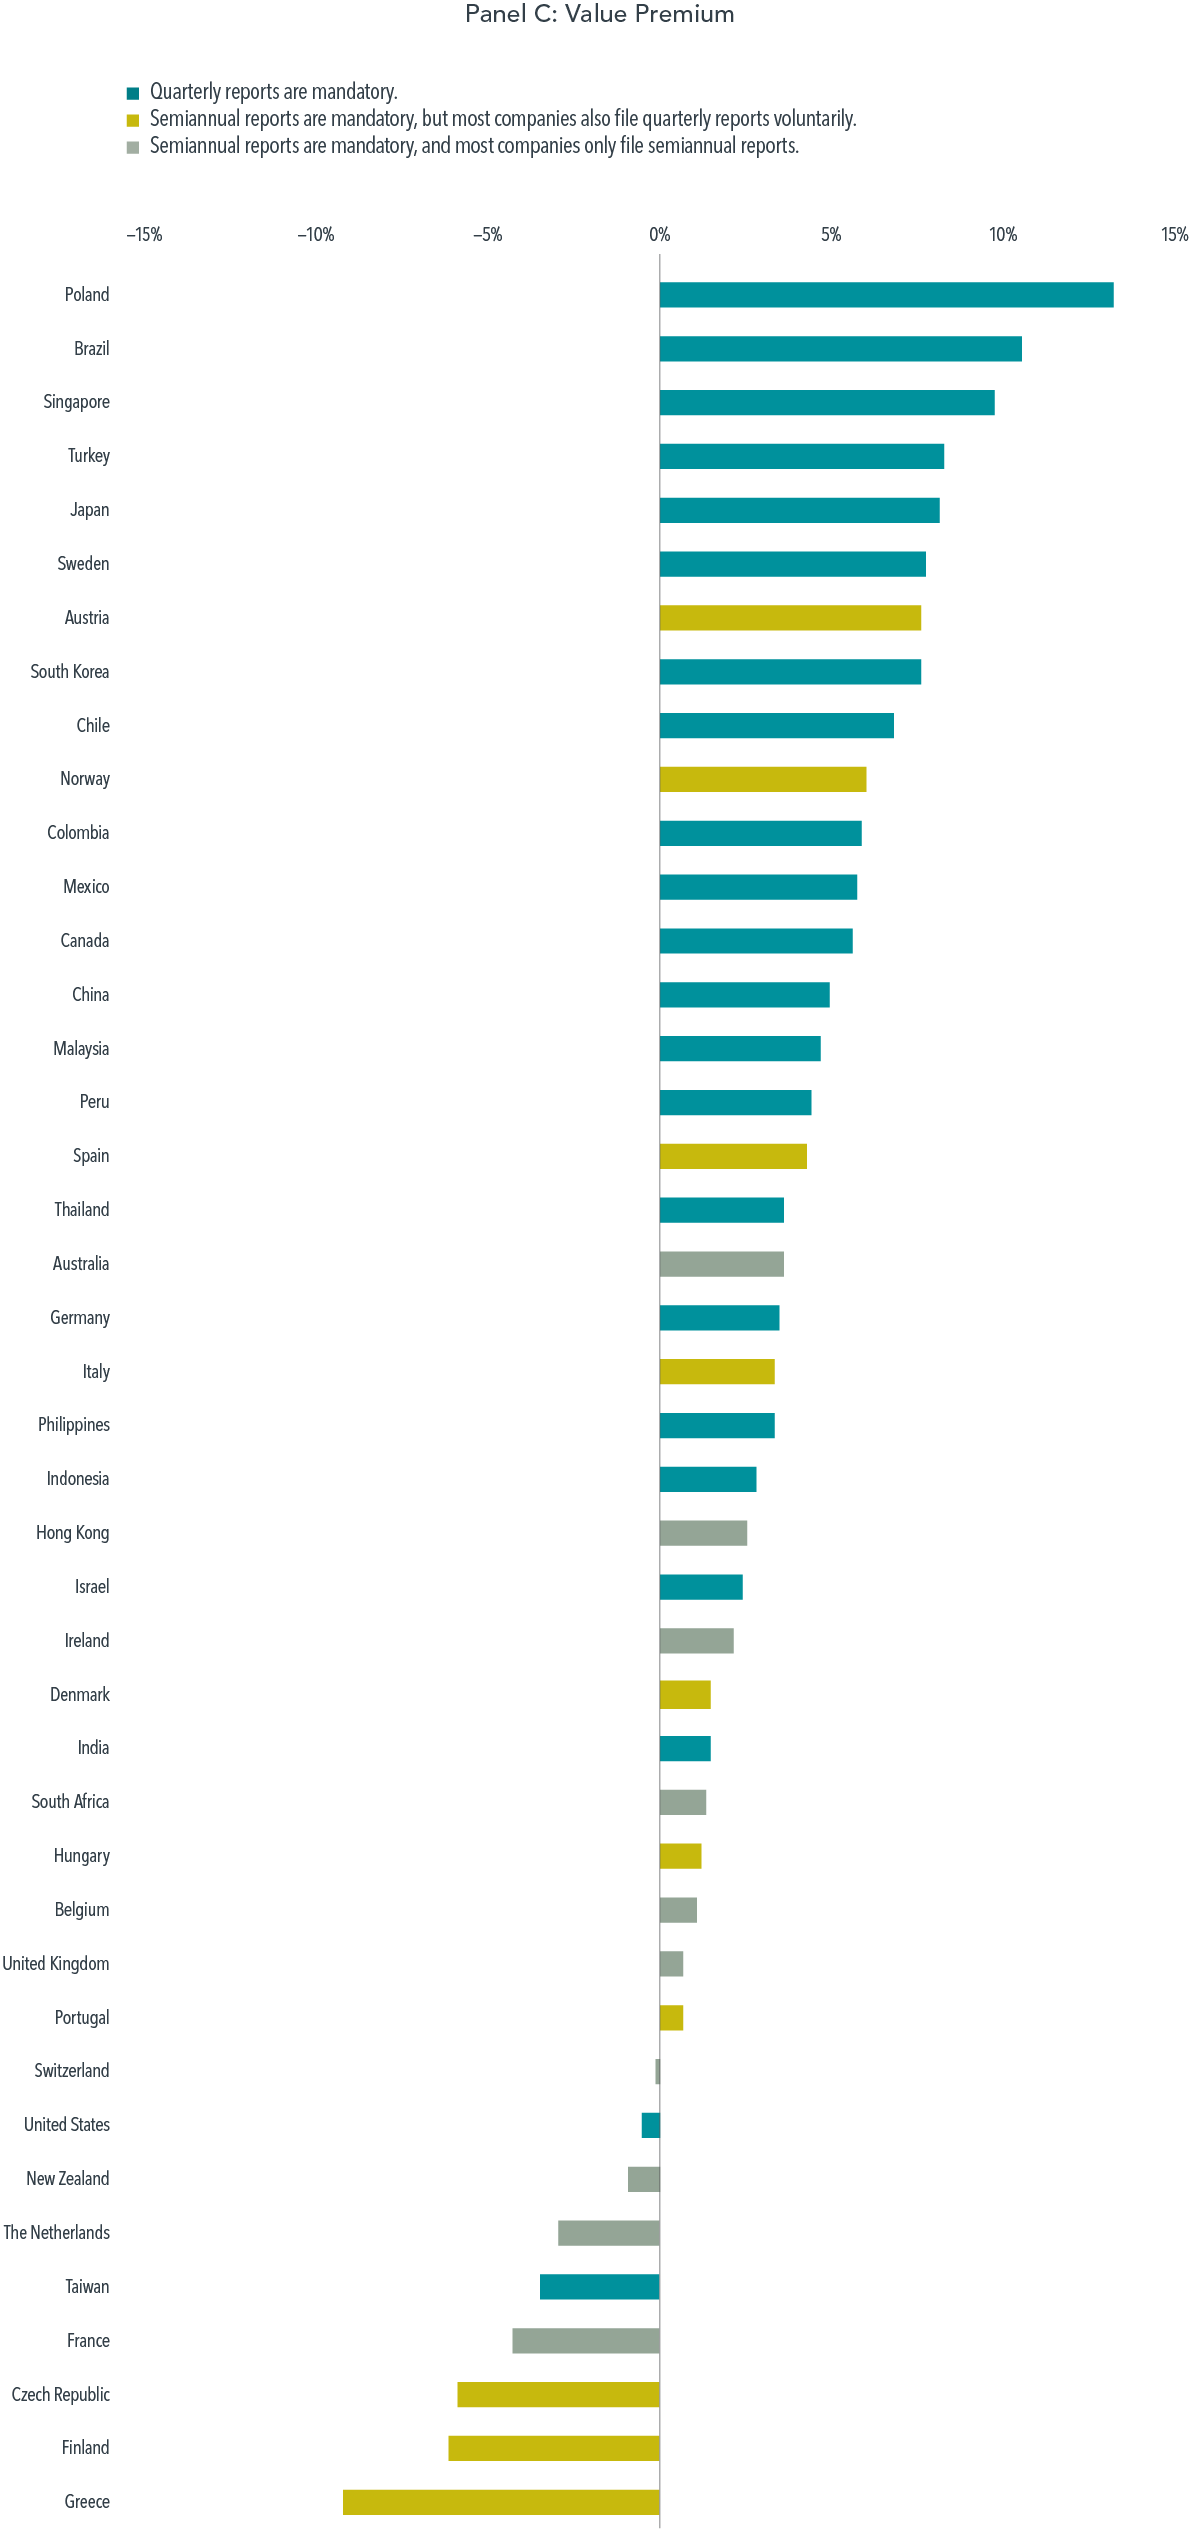
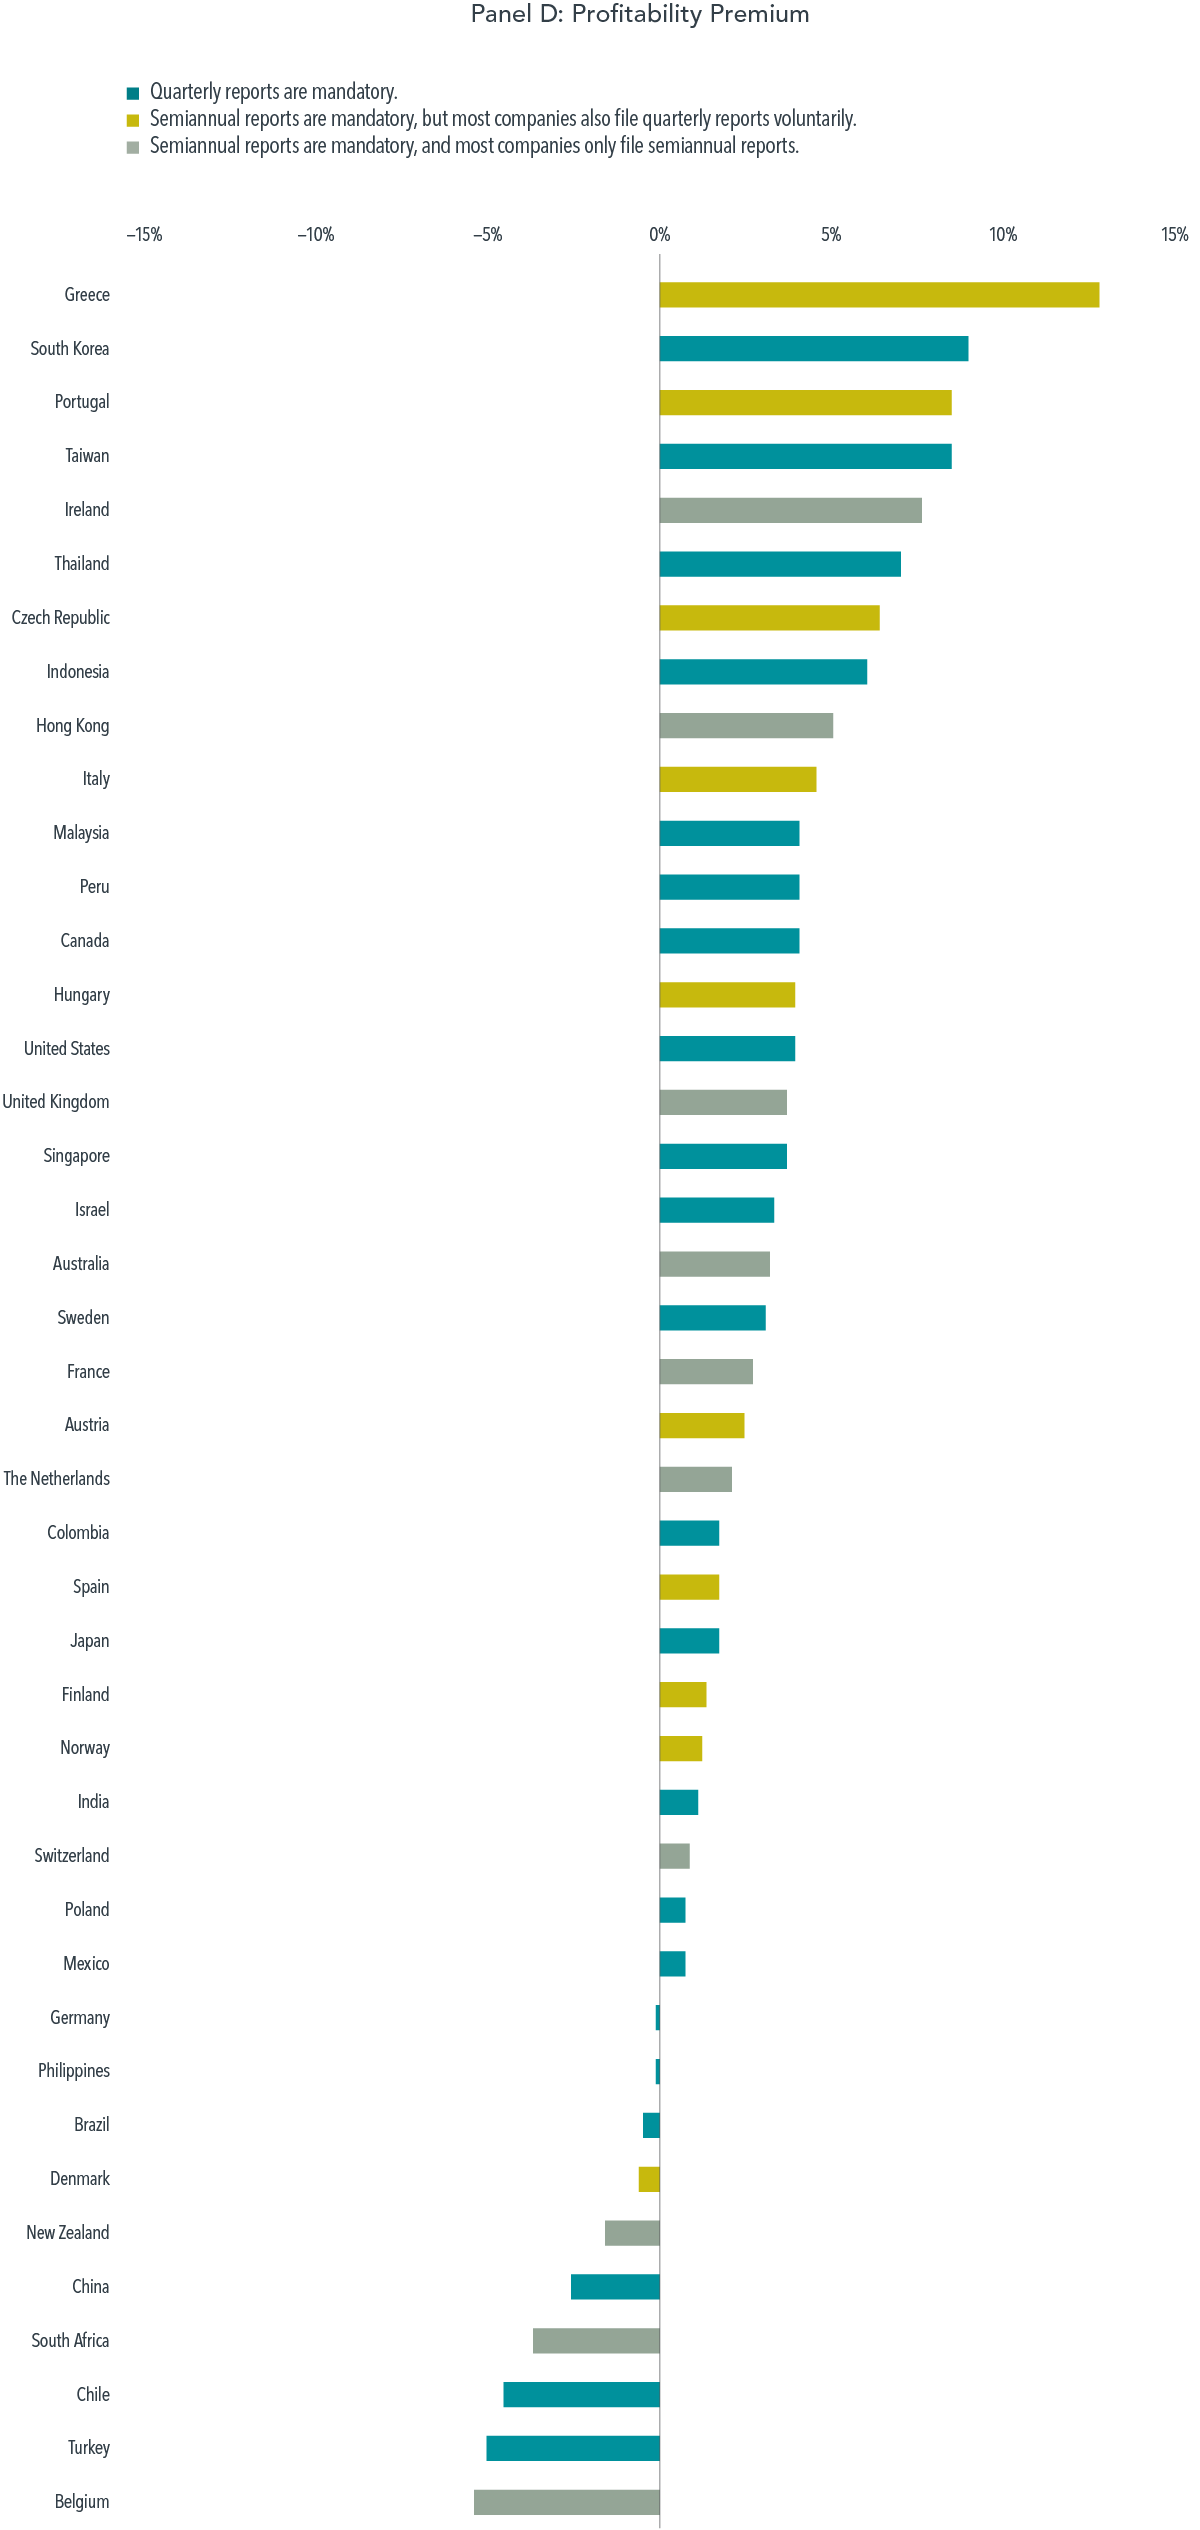
Beyond the US market history, we looked at 42 developed and emerging markets with varying requirements and classified them into the following three categories based on their regulations and observed reporting practices, as shown in Exhibit 2:2
- Mandatory quarterly (teal): 22 markets where quarterly reports are mandatory
- Voluntary quarterly (gold): 10 markets where semiannual reports are mandatory, but most companies file quarterly reports voluntarily
- Semiannual (gray): 10 markets where semiannual reports are mandatory, and most companies only file semiannual reports
Across these diverse reporting environments, premium performance reveals no discernible pattern. The magnitude of realized premiums varies from country to country, but the variation does not appear related to reporting frequency.
EXHIBIT 2
Average Annual Market Premiums, January 1975–December 2025
Investor Takeaway
Allowing companies to choose a reduced reporting frequency could lower companies’ compliance costs, but it raises concerns about information gaps as investors rely on older data. While the net impact is conceptually ambiguous, we used two methods to study this question empirically.
The lack of a clear link between reporting frequency and the magnitude of realized premiums is not surprising, as markets generally do a good job of incorporating information into prices, and holdings of portfolios based on the rankings of stocks on characteristics such as market capitalization, price-to-book, and profitability tend to be persistent over time. Furthermore, material events cannot be hidden, as publicly listed companies are required to disclose them immediately in most jurisdictions. For example, US companies must file a Form 8-K within four business days of the occurrence or determination of major events like acquisitions or bankruptcies.
So, in the end, whether the US stays on quarterly reporting or allows companies to choose to report semiannually, history tells us to stay calm and continue to enjoy the benefits that public equity markets provide.
Footnotes
1. Based on unpaired t-tests, differences in monthly averages across the two periods have t-statistics below 2 in absolute value.
2. The classification is based on Bloomberg data from 2005 to 2025, and the conclusions hold if we look at premium performance during this period. For markets that see regulation changes during this period, we use the reporting practice with the longest sample period.
Glossary
- Asset growth: Change in total assets from the prior fiscal year to current fiscal year.
- Book-to-market ratio: The ratio of a firm’s book value to its market value, where book value is the stockholder’s equity as reported on a company’s balance sheet, and market value is computed as price multiplied by shares outstanding.
- Form 8-K: A mandatory filing that publicly traded companies submit to the US Securities and Exchange Commission (SEC) to announce major, unscheduled corporate events.
- Profitability premium: The return difference between stocks of companies with high profitability and those with low profitability.
- Relative price: A company’s price, or the market value of its equity, in relation to another measure of economic value, such as book value.
- Size premium: The return difference between small capitalization stocks and large capitalization stocks.
- t-Statistic: A statistical quantity commonly used to test whether a sample average is reliably different from a specified value. Researchers often cite an absolute t-statistic value of at least 2.0 as the threshold for statistical reliability.
- Unpaired t-test: A statistical test comparing the means of two independent groups.
- Value premium: The return difference between stocks with low relative prices (value) and stocks with high relative prices (growth).
Appendix
As of December 31, 2025, countries currently included in Developed Markets are Australia, Austria, Belgium, Canada, Denmark, Finland, France, Germany, Hong Kong, Ireland, Israel, Italy, Japan, New Zealand, Norway, Portugal, Singapore, Spain, Sweden, Switzerland, the Netherlands, United Kingdom, and United States. Countries currently included in Emerging Markets are Brazil, Chile, China, Colombia, Czech Republic, Greece, Hungary, India, Indonesia, Kuwait, Malaysia, Mexico, Peru, Philippines, Poland, Qatar, Saudi Arabia, South Africa, South Korea, Taiwan, Thailand, Turkey, and United Arab Emirates.
Disclosures
The information in this material is intended for the recipient’s background information and use only. It is provided in good faith and without any warranty or representation as to accuracy or completeness. Information and opinions presented in this material have been obtained or derived from sources believed by Dimensional to be reliable, and Dimensional has reasonable grounds to believe that all factual information herein is true as at the date of this material. It does not constitute investment advice, a recommendation, or an offer of any services or products for sale and is not intended to provide a sufficient basis on which to make an investment decision. Before acting on any information in this document, you should consider whether it is appropriate for your particular circumstances and, if appropriate, seek professional advice. It is the responsibility of any persons wishing to make a purchase to inform themselves of and observe all applicable laws and regulations. Unauthorized reproduction or transmission of this material is strictly prohibited. Dimensional accepts no responsibility for loss arising from the use of the information contained herein.
This material is not directed at any person in any jurisdiction where the availability of this material is prohibited or would subject Dimensional or its products or services to any registration, licensing, or other such legal requirements within the jurisdiction.
“Dimensional” refers to the Dimensional separate but affiliated entities generally, rather than to one particular entity. These entities are Dimensional Fund Advisors LP, Dimensional Fund Advisors Ltd., Dimensional Ireland Limited, DFA Australia Limited, Dimensional Fund Advisors Canada ULC, Dimensional Fund Advisors Pte. Ltd., Dimensional Japan Ltd., and Dimensional Hong Kong Limited.
RISKS
Investments involve risks. The investment return and principal value of an investment may fluctuate so that an investor’s shares, when redeemed, may be worth more or less than their original value. Past performance is not a guarantee of future results. There is no guarantee strategies will be successful.
CANADA
These materials have been prepared by Dimensional Fund Advisors Canada ULC. The other Dimensional entities referenced herein are not registered resident investment fund managers or portfolio managers in Canada.
This material is not a sales communication. It is provided for educational purposes only, should not be construed as investment advice or an offer of any security for sale, and does not represent a recommendation of any particular security, strategy, or investment product.
This material is not intended for Quebec residents.
Commissions, trailing commissions, management fees, and expenses all may be associated with mutual fund investments. Please read the prospectus before investing. Unless otherwise noted, any indicated total rates of return reflect the historical annual compounded total returns, including changes in share or unit value and reinvestment of all dividends or other distributions, and do not take into account sales, redemption, distribution, or optional charges or income taxes payable by any security holder that would have reduced returns. Mutual funds are not guaranteed, their values change frequently, and past performance may not be repeated.
Resources


