Examining Growth Stocks’ Performance Surprise over the Last Decade
Since 2015, growth firms saw higher profits and valuations than value. Capturing premiums works best by weighing both valuation and future profitability.


KEY TAKEAWAYS
- From 2015 to 2024, growth firms reported higher operating profits than their historical average, while value firms maintained their historical level.
- While the spread in profitability between value and growth stocks has widened over time, so has the spread in valuations.
- An effective way to capture premiums reliably is to take both current valuations and expected future profitability into consideration.
The value premium is one of the most widely studied premiums in equity investing. Using data spanning nearly 100 years and from many markets around the world, academics and practitioners have found strong empirical support for the premium. Over the period from July 1926 to December 2014, the average value premium in the US large cap universe was 2.16% per year. But over the decade from January 2015 to December 2024, the realized premium was −11.6% per year. When something happens that does not match expectations, it’s natural to want to understand why.
Let’s start first with valuation theory, which provides a theoretical basis for the value premium’s existence. Valuation theory points to differences in expected returns between firms with lower and higher relative prices. Value firms are expected to deliver higher returns since investors are paying lower relative prices for a given level of cash flows they expect in the future. Thus, the theoretically expected value premium is positive every day. However, the realized premium is determined by expected and unexpected price movements. The latter can drive the realized premium negative at times.
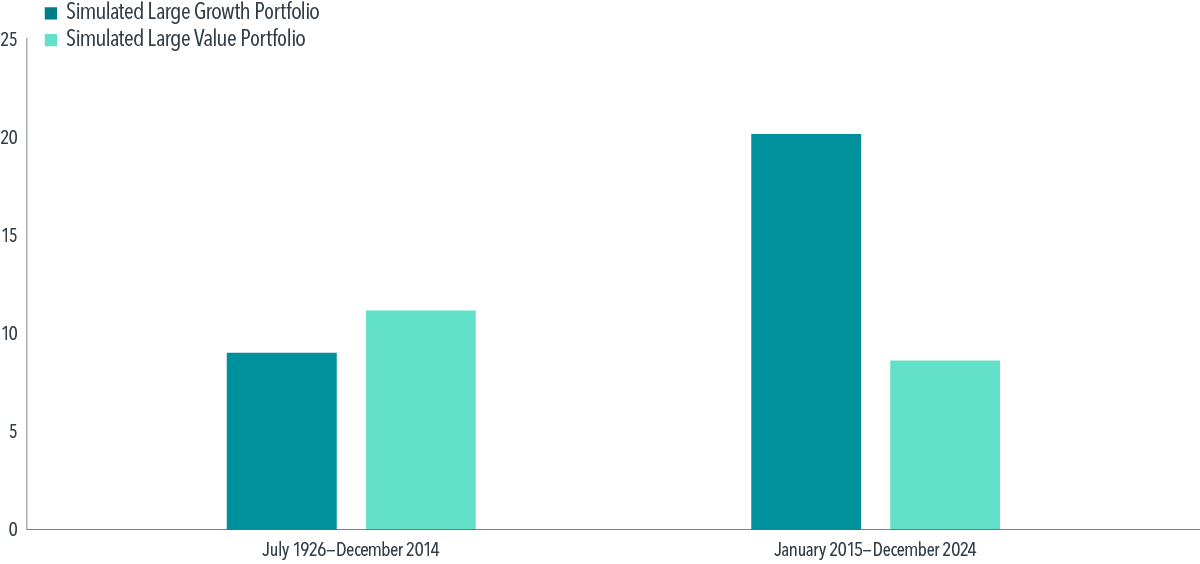
While the value premium significantly lagged expectations for the more recent period, Exhibit 1 illustrates that the absolute performance of value stocks was not far from its long-term average. Meanwhile, the recent performance of growth stocks significantly outstripped its long-term average.
EXHIBIT 1
Annualized Compound Returns (%) of Value and Growth Stocks in the US
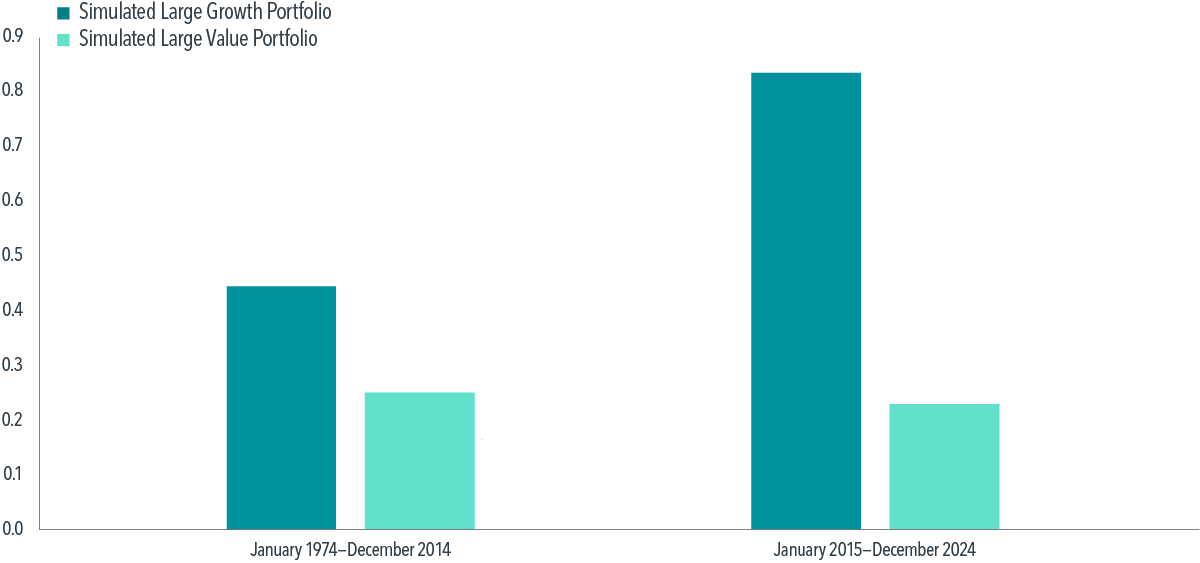
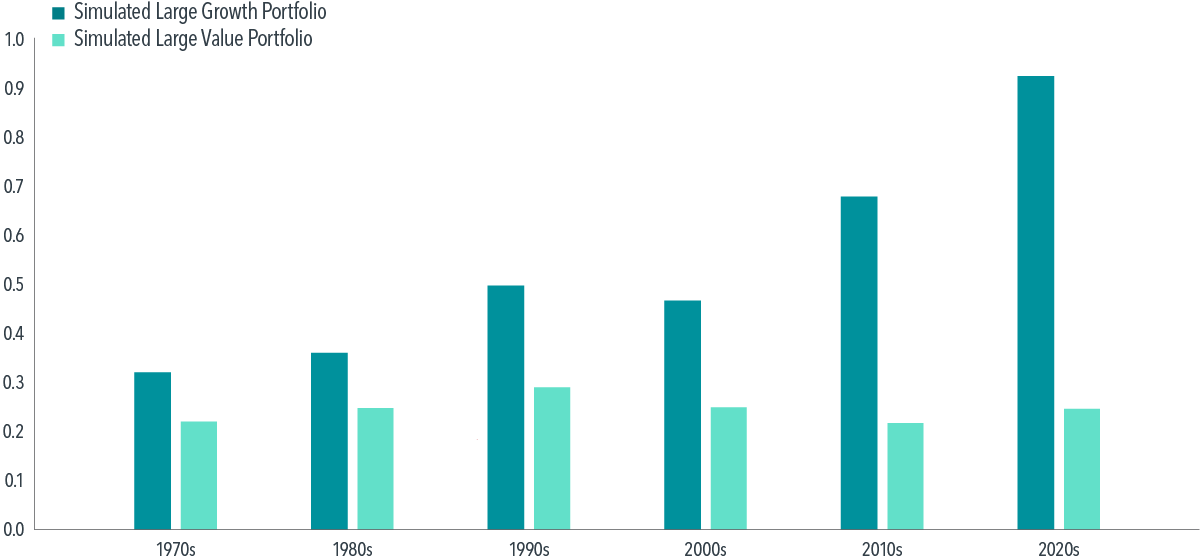
The fundamentals shed light on this recent outperformance of growth stocks.1Exhibit 2 Panel A compares the weighted-average profitability of value and growth firms.2 Over the last decade, growth firms reported higher operating profits than their historical average, while value firms maintained their historical level. Taking a granular look, Panel B presents the weighted-average profitability decade by decade, which reveals an unprecedented level of profitability for growth stocks in the 2020s.
EXHIBIT 2
Panel A: Weighted-Average Profitability
Panel B: Weighted-Average Profitability by Decade3
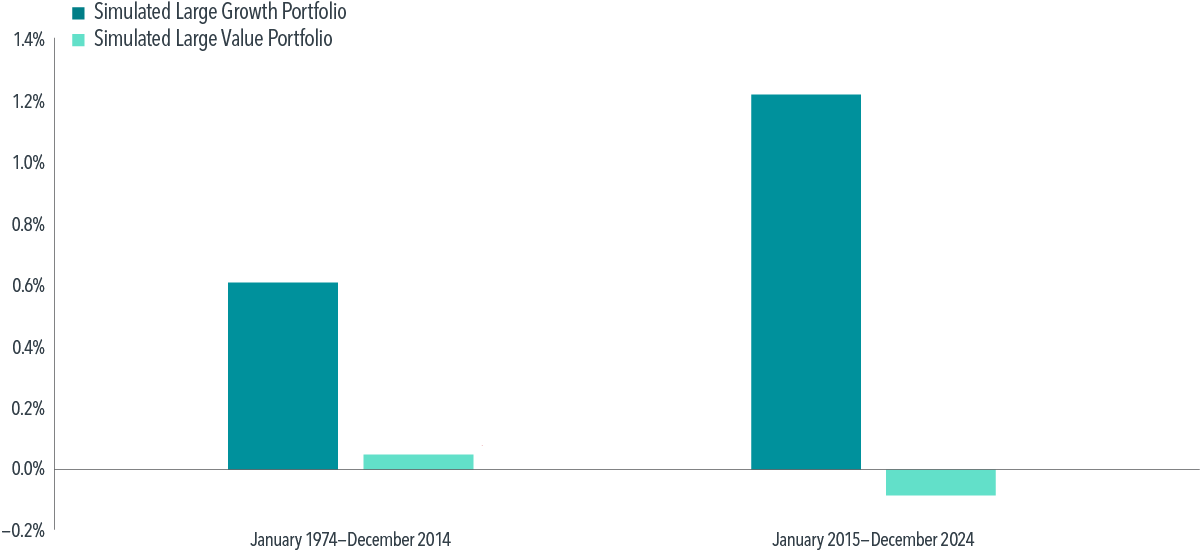
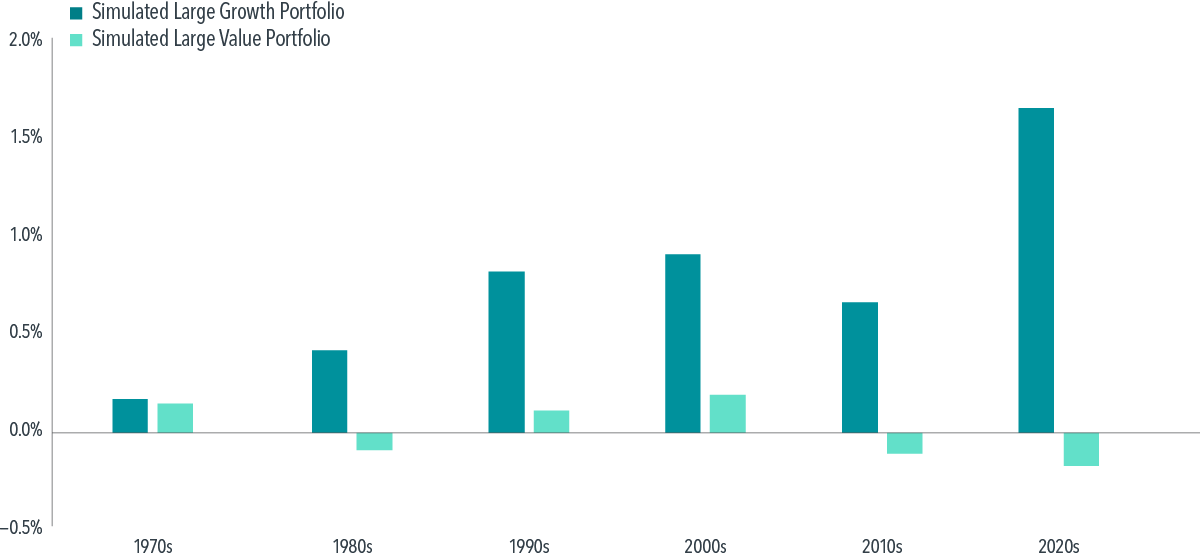
Did the market expect this increase in profitability? To address this question, we examine stock price reactions around earnings announcements. The academic community refers to these movements as cumulative abnormal returns—stock returns around earnings announcements in excess of the market. As shown in Exhibit 3, price movements around earnings announcements were substantially greater for growth firms over the past decade than their long-term average, painting a similar picture to the recent patterns in returns and profits for growth firms. Taken together, this evidence suggests that a large part of the recent outperformance of growth stocks stemmed from unexpected earnings strength.
Exhibit 3
Panel A: Weighted-Average Cumulative Abnormal Returns Around Earnings Announcements
Panel B: Weighted-Average Cumulative Abnormal Returns by Decade
Let’s look at a couple of recent examples of growth stocks. During the early phase of the COVID-19 pandemic, Clorox experienced a massive increase in demand for its cleaning and disinfecting products. In the third fiscal quarter of 2020, Clorox recorded year-over-year growth in revenue of 14.8% and earnings per share (EPS) of 31.3%, which exceeded the analyst consensus by 4.03% and 9.8%, respectively.4 Around this earnings announcement, it delivered an excess return of 11.78%.
In 2024, the widespread adoption of generative AI fueled demand for hardware, software, and cloud computing services and dramatically increased the year-over-year growth in revenue and earnings of AI-related companies.
In the third fiscal quarter of 2024, NVIDIA, the dominant supplier of graphics processing units, recorded quarterly revenue of $35.1 billion, up 94% from the prior year. Similarly, NVIDIA reported GAAP earnings per diluted share of $0.78,5 up 111% from a year earlier and exceeding the analyst consensus EPS forecast by 11.4%. The three-day market reaction to the earnings surprise was 10.6%.
Likewise, Oracle experienced accelerated growth in revenue and EPS in the first quarter of 2025 due to strong demand for cloud services. The company reported GAAP EPS of $1.03, up 20% year-over-year. Similarly, non-GAAP EPS of $1.39 represented year-over-year growth of 17% and exceeded the analyst consensus forecast of $1.32, resulting in 10.3% of the three-day market reaction to the earnings surprise.6
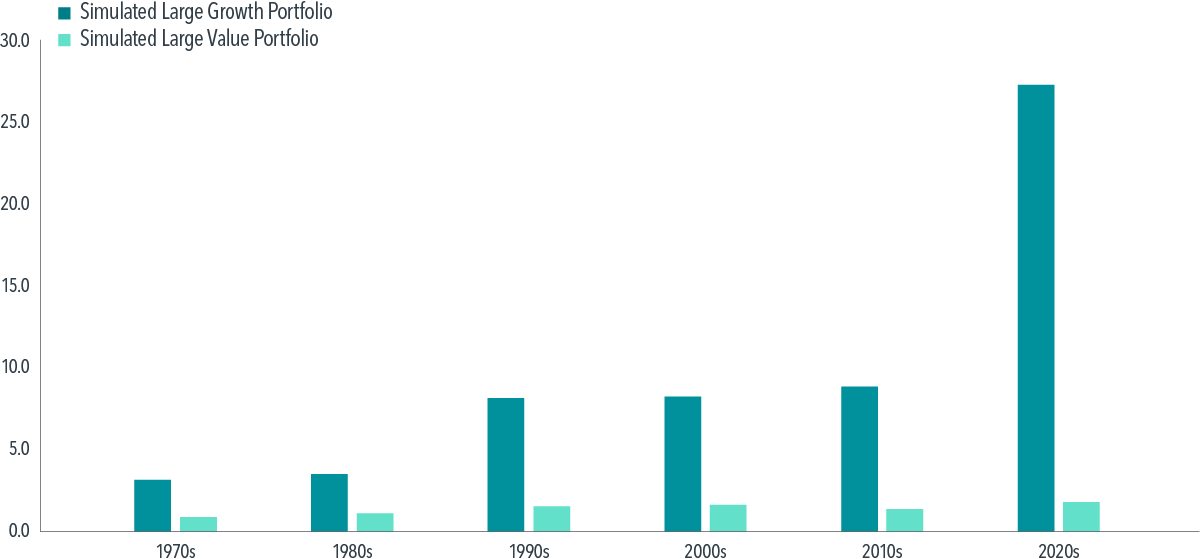
While the spread in profitability between value and growth stocks has widened over the sample period, so has the spread in valuations, as is evident in Exhibit 4.7 Unexpected improvement in operating performance helped to drive growth’s unexpectedly high return performance over the last decade, but market prices have adjusted, and valuations are at all-time highs.
Where does this take us? Back to valuation theory, which tells us that expected returns are driven by both valuations today and expected future profitability. Therefore, daily positioning of an investment strategy according to these sources of information remains an effective way to capture premiums reliably in pursuit of higher expected returns.
Exhibit 4
Aggregate Price-to-Book by Decade
Methodology
Source: Dimensional, using CRSP and Compustat data. The eligible universe includes stocks of all capitalization, excluding investment funds, tracking stocks, and REITs. The US large cap market represents approximately the top 92% of market capitalization.
At the end of each month, we form value-weighted growth and value portfolios based on the latest book-to-market ratio, capturing the bottom 30% and top 30% of capitalization, respectively.
The monthly weighted-average characteristics are averaged across the full sample period as well as decade by decade in Exhibits 2, 3, and 4.
Book-to-market ratios are bounded between 0 and the 99th percentile for the highest value. The aggregate price-to-book ratio is computed as the inverse of the weighted-average book-to-market ratio.
The level of profitability is defined as trailing four-quarter profits, scaled by latest-quarter book equity. Profits are defined as operating profits before depreciation and amortization, less interest expense. Book equity includes minority interest. Profitability is winsorized at the 1st percentile for the lowest value and the 99th percentile for the highest value.
Cumulative three-day abnormal returns (CAR3): the cumulative three-day returns around the most recent earnings announcement in excess of the market. Precisely, the three-day window includes the day before, the day of, and the day after an announcement. CAR3 is capped by −15% for the lowest value and 15% for the highest value.
Footnotes
1. We examine securities’ quarterly fundamentals from 1974 because the SEC adopted quarterly reporting frequency (Form 10-Q) in 1970. Moreover, Nasdaq joined the US stock market universe in the early 1970s, increasing the cross section greatly.
2. See the appendix for methodology and variable definitions.
3. The 1970s captures the period between July 1, 1974, and December 31, 1979. The 2020s captures the period between January 1, 2020, and December 31, 2024.
4. Source for year-over-year growth: “Clorox Reports Q3 Fiscal Year 2020 Results, Updates Fiscal Year Outlook,” News Details, The Clorox Company, May 2020; source for analyst consensus EPS: “NVIDIA Corporation Common Stock (NVDA) Earnings,” Nasdaq, February 2026.
5. “GAAP” stands for “Generally Accepted Accounting Principles.” Analyst consensus EPS obtained from Nasdaq.
6. Information obtained from CNBC.
7. We also find increasing spreads in price-to-earnings, price-to-cash flow, and price-to-operating profits.
Disclosures
This information is intended for educational purposes and should not be considered a recommendation to buy or sell a particular security. Named securities may be held in accounts managed by Dimensional.
FOR PROFESSIONAL USE ONLY. NOT FOR USE WITH RETAIL INVESTORS OR THE PUBLIC.
The information in this material is intended for the recipient’s background information and use only. It is provided in good faith and without any warranty or representation as to accuracy or completeness. Information and opinions presented in this material have been obtained or derived from sources believed by Dimensional to be reliable, and Dimensional has reasonable grounds to believe that all factual information herein is true as at the date of this material. It does not constitute investment advice, a recommendation, or an offer of any services or products for sale and is not intended to provide a sufficient basis on which to make an investment decision. Before acting on any information in this document, you should consider whether it is appropriate for your particular circumstances and, if appropriate, seek professional advice. It is the responsibility of any persons wishing to make a purchase to inform themselves of and observe all applicable laws and regulations. Unauthorized reproduction or transmission of this material is strictly prohibited. Dimensional accepts no responsibility for loss arising from the use of the information contained herein.
This material is not directed at any person in any jurisdiction where the availability of this material is prohibited or would subject Dimensional or its products or services to any registration, licensing, or other such legal requirements within the jurisdiction.
“Dimensional” refers to the Dimensional separate but affiliated entities generally, rather than to one particular entity. These entities are Dimensional Fund Advisors LP, Dimensional Fund Advisors Ltd., Dimensional Ireland Limited, DFA Australia Limited, Dimensional Fund Advisors Canada ULC, Dimensional Fund Advisors Pte. Ltd., Dimensional Japan Ltd., and Dimensional Hong Kong Limited.
RISKS
Investments involve risks. The investment return and principal value of an investment may fluctuate so that an investor’s shares, when redeemed, may be worth more or less than their original value. Past performance is not a guarantee of future results. There is no guarantee strategies will be successful.
CANADA
This material is issued by Dimensional Fund Advisors Canada ULC for advisors, dealers, and institutional investors and is not intended for public use. The other Dimensional entities referenced herein are not registered resident investment fund managers or portfolio managers in Canada.
This material is not intended for Quebec residents.
Commissions, trailing commissions, management fees, and expenses all may be associated with mutual fund investments. Please read the prospectus before investing. Unless otherwise noted, any indicated total rates of return reflect the historical annual compounded total returns, including changes in share or unit value and reinvestment of all dividends or other distributions, and do not take into account sales, redemption, distribution, or optional charges or income taxes payable by any security holder that would have reduced returns. Mutual funds are not guaranteed, their values change frequently, and past performance may not be repeated.
Resources