Are NVIDIA’s Earnings Big Enough for You?
Even with eye-catching earnings, NVIDIA’s size and valuation may leave investors questioning whether the stock can keep up with the market’s lofty outlook.


NVIDIA, at more than $4 trillion in market capitalization, is the largest stock to ever exist. The company’s quarterly earnings announcements have become Super Bowl-like events. In its August 2025 release, NVIDIA reported past-12-month earnings that were over 60% higher than this time last year, compared to an approximately 14% rise for combined S&P 500 earnings over the same period. Despite this, the stock fell slightly the next day.
NVIDIA’s earnings were immense, but the price tag for those earnings is steep. As of August 31, 2025, NVIDIA’s market cap made it nearly 8% of the S&P 500 Index. Its last 12 months of earnings were $87 billion, or around 4% of the approximately $2 trillion in total S&P 500 Index earnings. For investors seeking higher returns, the company’s size and high valuation relative to peers suggest that markets continue to price in high future cash flows, lower expected returns, or a combination of both. As a result, even when NVIDIA announces eye-wateringly high earnings, its price may still drop.
Stock prices are an investor’s most valuable source of information and contain the market’s aggregated outlook for a stock’s future. Investors who own the broad market will get a slice of NVIDIA, including a claim on NVIDIA’s future earnings.
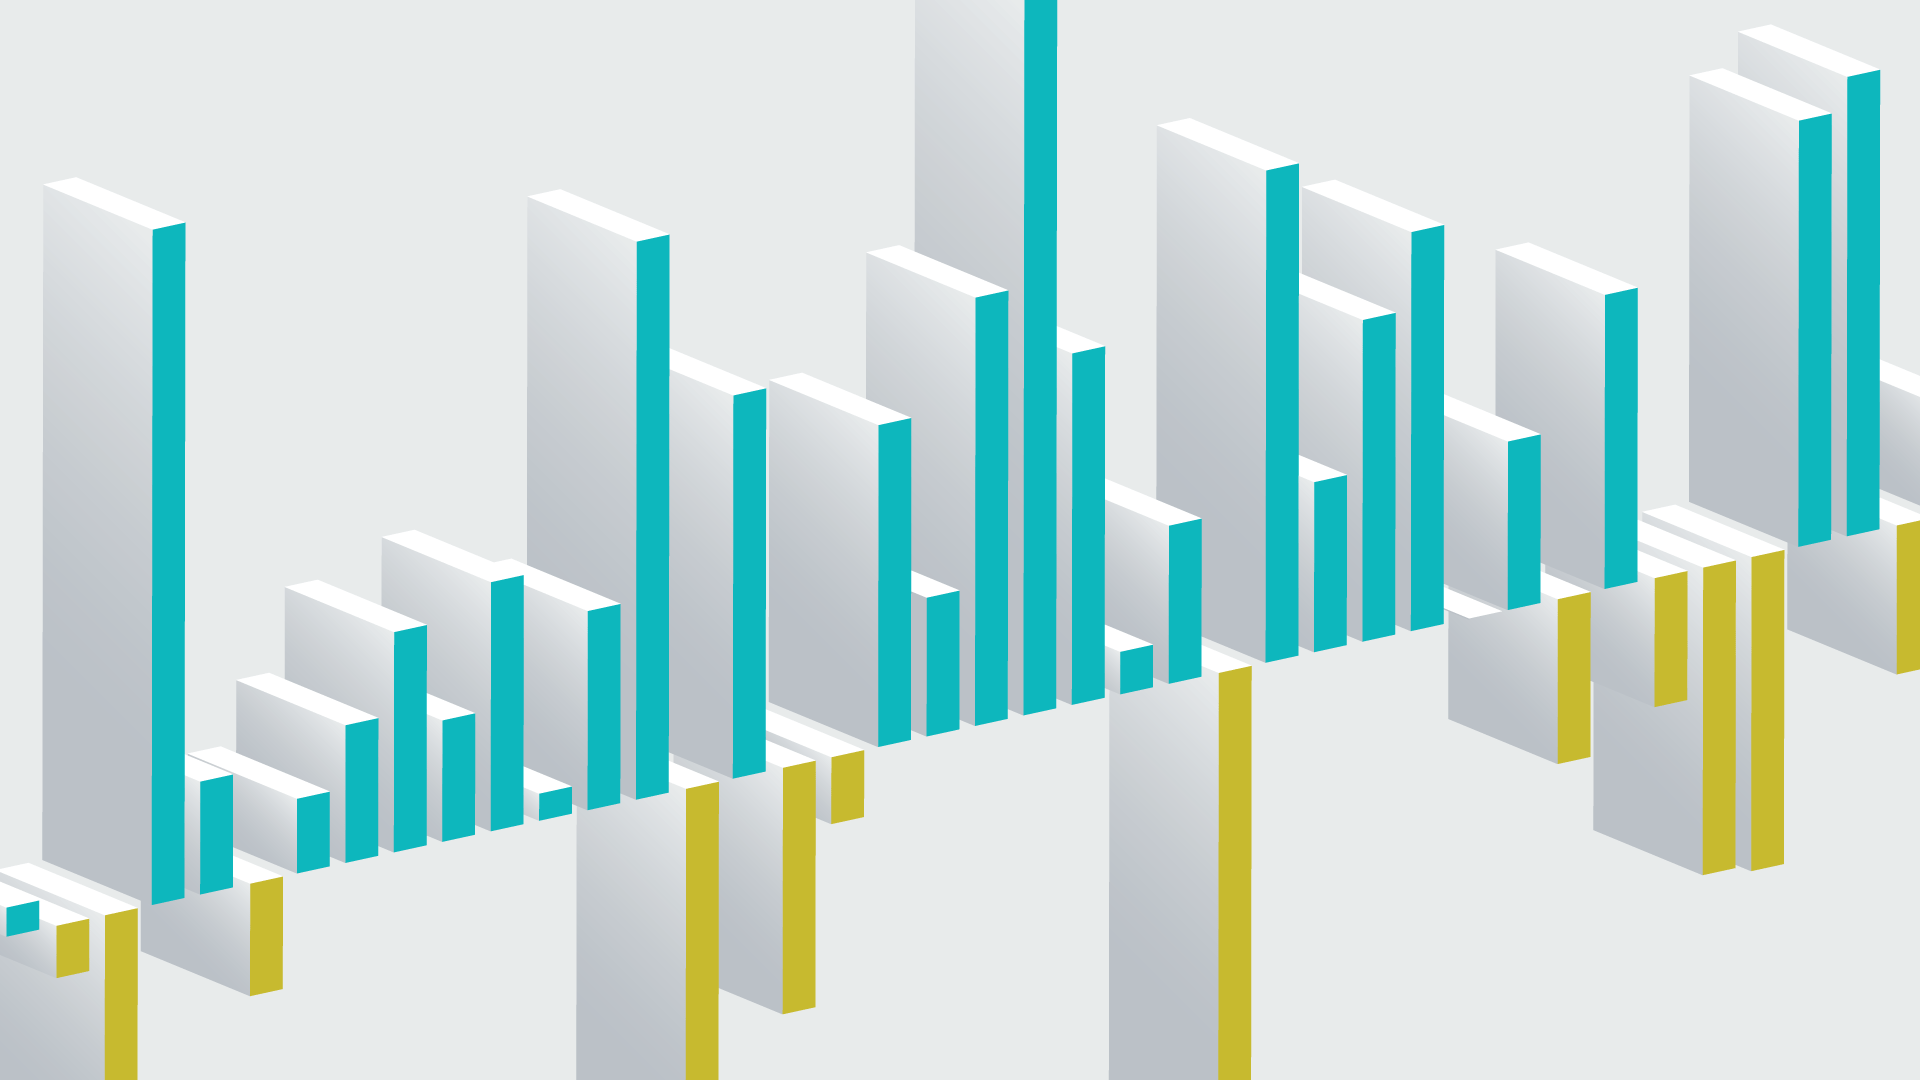
EXHIBIT 1
NVIDIA S&P Weight vs. S&P 500 Share of Earnings as of August 31, 2025

Disclosures
Source: FactSet. NVIDIA market cap as a percentage of the S&P 500 Index was calculated by Dimensional.
This information is intended for educational purposes and should not be considered a recommendation to buy or sell a particular security. Named securities may be held in accounts managed by Dimensional.
The information in this material is intended for the recipient’s background information and use only. It is provided in good faith and without any warranty or representation as to accuracy or completeness. Information and opinions presented in this material have been obtained or derived from sources believed by Dimensional to be reliable, and Dimensional has reasonable grounds to believe that all factual information herein is true as at the date of this material. It does not constitute investment advice, a recommendation, or an offer of any services or products for sale and is not intended to provide a sufficient basis on which to make an investment decision. Before acting on any information in this document, you should consider whether it is appropriate for your particular circumstances and, if appropriate, seek professional advice. It is the responsibility of any persons wishing to make a purchase to inform themselves of and observe all applicable laws and regulations. Unauthorized reproduction or transmission of this material is strictly prohibited. Dimensional accepts no responsibility for loss arising from the use of the information contained herein.
This material is not directed at any person in any jurisdiction where the availability of this material is prohibited or would subject Dimensional or its products or services to any registration, licensing, or other such legal requirements within the jurisdiction.
“Dimensional” refers to the Dimensional separate but affiliated entities generally, rather than to one particular entity. These entities are Dimensional Fund Advisors LP, Dimensional Fund Advisors Ltd., Dimensional Ireland Limited, DFA Australia Limited, Dimensional Fund Advisors Canada ULC, Dimensional Fund Advisors Pte. Ltd., Dimensional Japan Ltd., and Dimensional Hong Kong Limited. Dimensional Hong Kong Limited is licensed by the Securities and Futures Commission to conduct Type 1 (dealing in securities) regulated activities only and does not provide asset management services.
RISKS
Investments involve risks. The investment return and principal value of an investment may fluctuate so that an investor’s shares, when redeemed, may be worth more or less than their original value. Past performance is not a guarantee of future results. There is no guarantee strategies will be successful.
CANADA
These materials have been prepared by Dimensional Fund Advisors Canada ULC. The other Dimensional entities referenced herein are not registered resident investment fund managers or portfolio managers in Canada.
This material is not intended for Quebec residents.
Commissions, trailing commissions, management fees, and expenses all may be associated with mutual fund investments. Please read the prospectus before investing. Unless otherwise noted, any indicated total rates of return reflect the historical annual compounded total returns, including changes in share or unit value and reinvestment of all dividends or other distributions, and do not take into account sales, redemption, distribution, or optional charges or income taxes payable by any security holder that would have reduced returns. Mutual funds are not guaranteed, their values change frequently, and past performance may not be repeated.
Resources